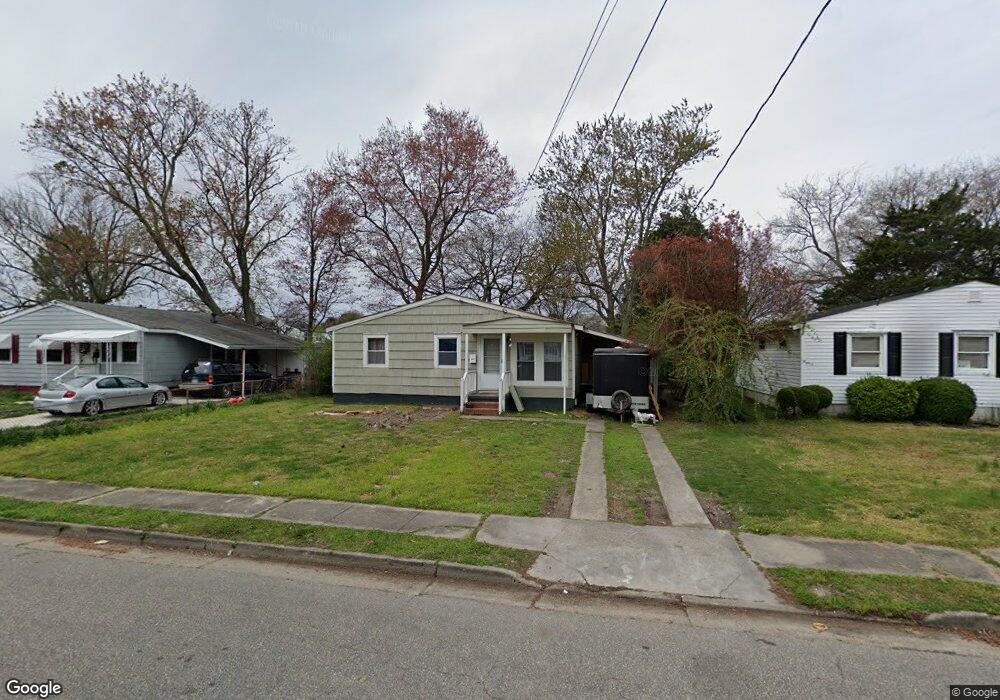
139 Ransone St Hampton, VA 23669
Willow Oaks NeighborhoodEstimated Value: $168,000 - $252,000
3
Beds
1
Bath
984
Sq Ft
$203/Sq Ft
Est. Value
About This Home
This home is located at 139 Ransone St, Hampton, VA 23669 and is currently estimated at $199,717, approximately $202 per square foot. 139 Ransone St is a home located in Hampton City with nearby schools including Mary S. Peake Elementary School, C. Alton Lindsay Middle School, and Hampton High School.
Ownership History
Date
Name
Owned For
Owner Type
Purchase Details
Closed on
Nov 8, 2018
Sold by
Secretary Of H U D Of Washington Dc
Bought by
Barclay Elizabeth and Verasammy Marcus R
Current Estimated Value
Home Financials for this Owner
Home Financials are based on the most recent Mortgage that was taken out on this home.
Original Mortgage
$77,650
Outstanding Balance
$69,213
Interest Rate
5.5%
Mortgage Type
FHA
Estimated Equity
$130,504
Purchase Details
Closed on
Jul 20, 2018
Sold by
Brian Dolan Law Offices Pllc
Bought by
The Secretary Of The U S Department Of H
Purchase Details
Closed on
Jun 20, 2014
Sold by
Aremlino Anthony M
Bought by
Collazo Ciara L
Home Financials for this Owner
Home Financials are based on the most recent Mortgage that was taken out on this home.
Original Mortgage
$77,569
Interest Rate
4.12%
Mortgage Type
FHA
Create a Home Valuation Report for This Property
The Home Valuation Report is an in-depth analysis detailing your home's value as well as a comparison with similar homes in the area
Home Values in the Area
Average Home Value in this Area
Purchase History
| Date | Buyer | Sale Price | Title Company |
|---|---|---|---|
| Barclay Elizabeth | $78,000 | Virginia Home Title&Stlmnts | |
| The Secretary Of The U S Department Of H | $81,603 | None Available | |
| Collazo Ciara L | $79,000 | -- |
Source: Public Records
Mortgage History
| Date | Status | Borrower | Loan Amount |
|---|---|---|---|
| Open | Barclay Elizabeth | $77,650 | |
| Previous Owner | Collazo Ciara L | $77,569 |
Source: Public Records
Tax History
| Year | Tax Paid | Tax Assessment Tax Assessment Total Assessment is a certain percentage of the fair market value that is determined by local assessors to be the total taxable value of land and additions on the property. | Land | Improvement |
|---|---|---|---|---|
| 2025 | $1,991 | $163,400 | $45,000 | $118,400 |
| 2024 | $1,823 | $158,500 | $45,000 | $113,500 |
| 2023 | $1,514 | $130,500 | $45,000 | $85,500 |
| 2022 | $1,404 | $119,000 | $40,000 | $79,000 |
| 2021 | $1,426 | $104,500 | $31,500 | $73,000 |
| 2020 | $1,236 | $99,700 | $28,900 | $70,800 |
| 2019 | $1,218 | $98,200 | $28,900 | $69,300 |
| 2018 | $1,194 | $94,700 | $28,900 | $65,800 |
| 2017 | $1,268 | $0 | $0 | $0 |
| 2016 | $1,258 | $93,900 | $0 | $0 |
| 2015 | $1,258 | $0 | $0 | $0 |
| 2014 | $1,254 | $90,500 | $28,900 | $61,600 |
Source: Public Records
Map
Nearby Homes
- 201 Courtney Dr
- 206 Lantana Ln
- 206 Lantana Ln Unit B
- 111 Roane Dr Unit F
- 111 Roane Dr Unit D
- 109 Roane Dr Unit C
- 224 Bailey Park Dr
- 107 Roland Dr
- 408 Roane Dr
- 319 Shoreline Dr
- 413 W Gilbert St
- 135 Roland Dr
- 1263 N King St
- 1209 Parkside Ave
- 35 Westover St
- 67 W Little Back River Rd
- 39 Longwood Dr
- 69 W Little Back River Rd
- 26 Monroe Dr
- 28 N Gawain Way
Your Personal Tour Guide
Ask me questions while you tour the home.