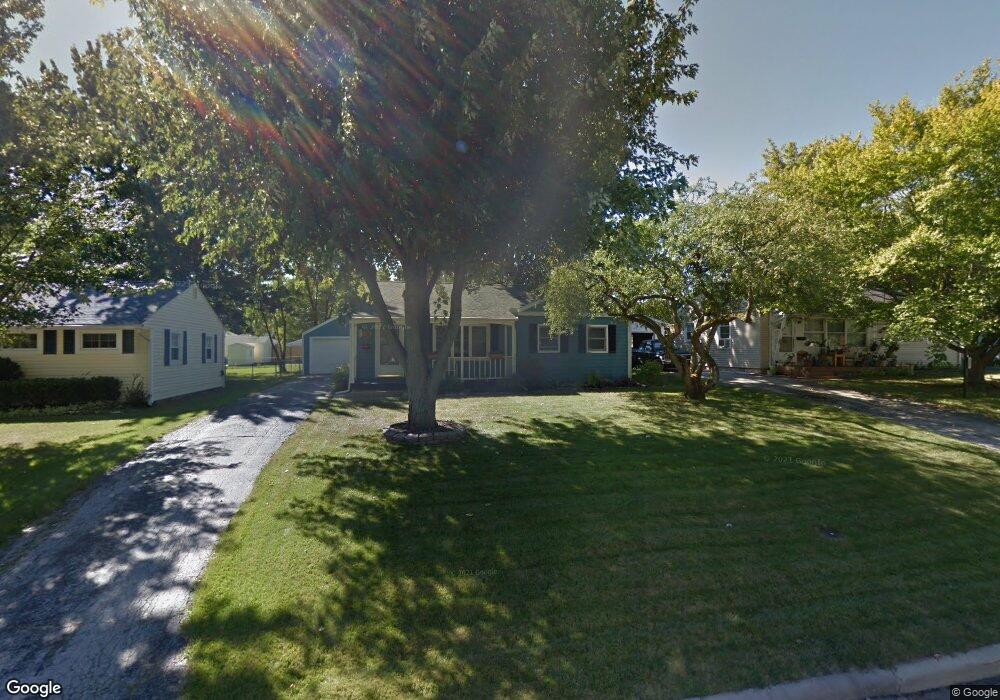
139 Springbrook Dr Findlay, OH 45840
Estimated Value: $142,344 - $198,000
3
Beds
1
Bath
912
Sq Ft
$186/Sq Ft
Est. Value
About This Home
This home is located at 139 Springbrook Dr, Findlay, OH 45840 and is currently estimated at $169,586, approximately $185 per square foot. 139 Springbrook Dr is a home located in Hancock County with nearby schools including Bigelow Hill Elementary School, Northview Elementary School, and Glenwood Middle School.
Ownership History
Date
Name
Owned For
Owner Type
Purchase Details
Closed on
Mar 7, 2006
Sold by
Pocock Larry T and Pocock Siu Yee
Bought by
Pocock Larry T and Pocock Siu Yee
Current Estimated Value
Purchase Details
Closed on
Nov 14, 2003
Sold by
Bish Nicholas J and Bish Rachel D
Bought by
Pocock Larry T
Home Financials for this Owner
Home Financials are based on the most recent Mortgage that was taken out on this home.
Original Mortgage
$88,065
Outstanding Balance
$40,287
Interest Rate
5.81%
Mortgage Type
VA
Estimated Equity
$129,299
Purchase Details
Closed on
Apr 5, 1999
Sold by
Campbell Mildred
Bought by
Bish Nicholas and Rowe Rachel
Home Financials for this Owner
Home Financials are based on the most recent Mortgage that was taken out on this home.
Original Mortgage
$69,464
Interest Rate
6.89%
Mortgage Type
FHA
Create a Home Valuation Report for This Property
The Home Valuation Report is an in-depth analysis detailing your home's value as well as a comparison with similar homes in the area
Home Values in the Area
Average Home Value in this Area
Purchase History
| Date | Buyer | Sale Price | Title Company |
|---|---|---|---|
| Pocock Larry T | -- | Golden Key Title Agency | |
| Pocock Larry T | $85,500 | Golden Key Title | |
| Bish Nicholas | $69,500 | -- |
Source: Public Records
Mortgage History
| Date | Status | Borrower | Loan Amount |
|---|---|---|---|
| Open | Pocock Larry T | $88,065 | |
| Previous Owner | Bish Nicholas | $69,464 |
Source: Public Records
Tax History
| Year | Tax Paid | Tax Assessment Tax Assessment Total Assessment is a certain percentage of the fair market value that is determined by local assessors to be the total taxable value of land and additions on the property. | Land | Improvement |
|---|---|---|---|---|
| 2024 | $1,238 | $34,860 | $5,860 | $29,000 |
| 2023 | $1,240 | $34,860 | $5,860 | $29,000 |
| 2022 | $1,236 | $34,860 | $5,860 | $29,000 |
| 2021 | $1,178 | $28,950 | $5,850 | $23,100 |
| 2020 | $1,178 | $28,950 | $5,850 | $23,100 |
| 2019 | $1,154 | $28,950 | $5,850 | $23,100 |
| 2018 | $1,098 | $25,260 | $5,080 | $20,180 |
| 2017 | $549 | $25,260 | $5,080 | $20,180 |
| 2016 | $1,092 | $25,260 | $5,080 | $20,180 |
| 2015 | $945 | $21,620 | $5,080 | $16,540 |
| 2014 | $945 | $21,620 | $5,080 | $16,540 |
| 2012 | $906 | $20,540 | $5,080 | $15,460 |
Source: Public Records
Map
Nearby Homes
- 3239 N Main St
- 128 Harrington Ave
- 2604 N Main St
- 3315 Norcrest St
- 323 W Bigelow Ave
- 0 County Road 220 Lot 2
- 241 Stanley Ave
- 245 Edinborough Dr
- 2400 Hollybrook Dr
- 2605 Eton Place
- 400 Rosewood Ave
- 2419 Hollybrook Dr
- 120 W Melrose Ave
- 315 W Melrose Ave
- 0 County Road 220 Lot 4
- 0 County Road 220 Unit 10004662
- 0 County Road 220 Lot 3
- 0 County Road 220 Unit 10004663
- 0 County Road 220 Unit 10004661
- 239 Edith Ave
- 133 Springbrook Dr
- 145 Springbrook Dr
- 151 Springbrook Dr
- 127 Springbrook Dr
- 3012 Terrace Dr
- 3006 Terrace Dr
- 140 Springbrook Dr
- 134 Springbrook Dr
- 146 Springbrook Dr
- 209 Springbrook Dr
- 115 Springbrook Dr
- 152 Springbrook Dr
- 128 Springbrook Dr
- 3000 Terrace Dr
- 206 Terrace Dr
- 200 Springbrook Dr
- 122 Springbrook Dr
- 211 Springbrook Dr
- 116 Springbrook Dr
- 206 Springbrook Dr
Your Personal Tour Guide
Ask me questions while you tour the home.