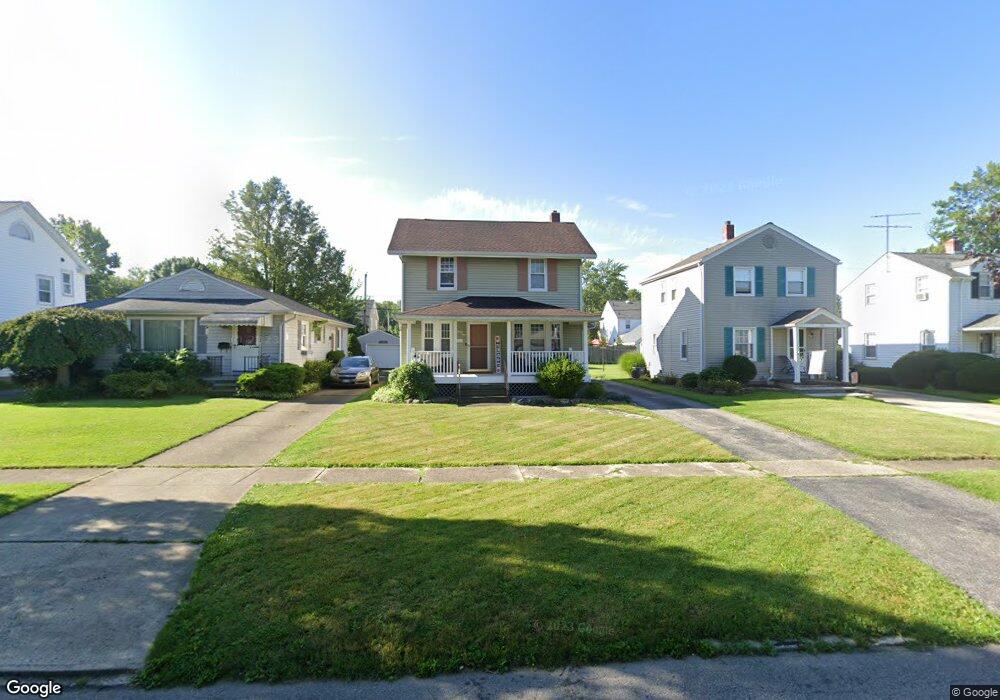
139 Stanford Ave Elyria, OH 44035
Estimated Value: $150,682 - $185,000
3
Beds
1
Bath
1,140
Sq Ft
$145/Sq Ft
Est. Value
About This Home
This home is located at 139 Stanford Ave, Elyria, OH 44035 and is currently estimated at $165,421, approximately $145 per square foot. 139 Stanford Ave is a home located in Lorain County with nearby schools including Eastern Heights Middle School, Elyria High School, and Constellation Schools: Elyria Community Elementary.
Ownership History
Date
Name
Owned For
Owner Type
Purchase Details
Closed on
Dec 4, 2020
Sold by
Willbond Matthew J
Bought by
Oates Brandy
Current Estimated Value
Home Financials for this Owner
Home Financials are based on the most recent Mortgage that was taken out on this home.
Original Mortgage
$88,369
Outstanding Balance
$78,815
Interest Rate
2.8%
Mortgage Type
FHA
Estimated Equity
$86,606
Purchase Details
Closed on
May 28, 2008
Sold by
Csizmadia Joseph M and Csizmadia Cynthia
Bought by
Willbond Matthew J
Home Financials for this Owner
Home Financials are based on the most recent Mortgage that was taken out on this home.
Original Mortgage
$96,485
Interest Rate
5.93%
Mortgage Type
FHA
Purchase Details
Closed on
Jun 6, 1994
Sold by
Kohl Paul E
Bought by
Csizmadia Joseph M
Home Financials for this Owner
Home Financials are based on the most recent Mortgage that was taken out on this home.
Original Mortgage
$60,000
Interest Rate
8.48%
Mortgage Type
New Conventional
Create a Home Valuation Report for This Property
The Home Valuation Report is an in-depth analysis detailing your home's value as well as a comparison with similar homes in the area
Home Values in the Area
Average Home Value in this Area
Purchase History
| Date | Buyer | Sale Price | Title Company |
|---|---|---|---|
| Oates Brandy | $90,000 | None Available | |
| Willbond Matthew J | $98,000 | Attorney | |
| Csizmadia Joseph M | $79,650 | -- |
Source: Public Records
Mortgage History
| Date | Status | Borrower | Loan Amount |
|---|---|---|---|
| Open | Oates Brandy | $88,369 | |
| Previous Owner | Willbond Matthew J | $96,485 | |
| Previous Owner | Csizmadia Joseph M | $60,000 |
Source: Public Records
Tax History
| Year | Tax Paid | Tax Assessment Tax Assessment Total Assessment is a certain percentage of the fair market value that is determined by local assessors to be the total taxable value of land and additions on the property. | Land | Improvement |
|---|---|---|---|---|
| 2024 | $1,923 | $39,942 | $5,999 | $33,943 |
| 2023 | $1,742 | $31,224 | $6,143 | $25,081 |
| 2022 | $1,728 | $31,224 | $6,143 | $25,081 |
| 2021 | $1,724 | $31,224 | $6,143 | $25,081 |
| 2020 | $1,675 | $26,710 | $5,250 | $21,460 |
| 2019 | $1,624 | $26,710 | $5,250 | $21,460 |
| 2018 | $1,713 | $26,710 | $5,250 | $21,460 |
| 2017 | $1,799 | $28,320 | $5,630 | $22,690 |
| 2016 | $1,776 | $28,320 | $5,630 | $22,690 |
| 2015 | $1,663 | $28,320 | $5,630 | $22,690 |
| 2014 | $1,627 | $28,030 | $5,570 | $22,460 |
| 2013 | $1,611 | $28,030 | $5,570 | $22,460 |
Source: Public Records
Map
Nearby Homes
- 135 Stanford Ave
- 141 Stanford Ave
- 145 Stanford Ave
- 133 Stanford Ave
- 129 Stanford Ave
- 149 Stanford Ave
- 136 Columbia Ave
- 132 Columbia Ave
- 140 Columbia Ave
- 128 Columbia Ave
- 151 Stanford Ave
- 125 Stanford Ave
- 144 Columbia Ave
- 126 Columbia Ave
- 140 Stanford Ave
- 144 Stanford Ave
- 136 Stanford Ave
- 155 Stanford Ave
- 121 Stanford Ave
- 146 Stanford Ave
Your Personal Tour Guide
Ask me questions while you tour the home.