Estimated Value: $255,000 - $352,000
3
Beds
3
Baths
1,494
Sq Ft
$190/Sq Ft
Est. Value
About This Home
This home is located at 13916 Flay Ave N, Hugo, MN 55038 and is currently estimated at $284,094, approximately $190 per square foot. 13916 Flay Ave N is a home located in Washington County with nearby schools including Oneka Elementary School, Hugo Elementary School, and Central Middle School.
Ownership History
Date
Name
Owned For
Owner Type
Purchase Details
Closed on
Nov 26, 2019
Sold by
Phepls Yeager Wade and Yeager Katherine Ann
Bought by
Okpoyo Glory Nyong
Current Estimated Value
Home Financials for this Owner
Home Financials are based on the most recent Mortgage that was taken out on this home.
Original Mortgage
$182,631
Outstanding Balance
$161,079
Interest Rate
3.62%
Mortgage Type
FHA
Estimated Equity
$123,015
Purchase Details
Closed on
Jan 14, 2016
Sold by
Phelps Yeager Wade and Phelps Yeager Katherine
Bought by
Phelps Yeager Wade and Phelps Yeager Katherine
Home Financials for this Owner
Home Financials are based on the most recent Mortgage that was taken out on this home.
Original Mortgage
$142,558
Interest Rate
3.25%
Mortgage Type
FHA
Purchase Details
Closed on
Apr 30, 2004
Sold by
Daniel Michael J and Daniel Melanie F
Bought by
Phelps Yeager Wade and Lomker Katherine
Purchase Details
Closed on
Jul 27, 2000
Sold by
Sedona Homes Inc
Bought by
Daniel Michael and Daniel Melanie
Create a Home Valuation Report for This Property
The Home Valuation Report is an in-depth analysis detailing your home's value as well as a comparison with similar homes in the area
Home Values in the Area
Average Home Value in this Area
Purchase History
| Date | Buyer | Sale Price | Title Company |
|---|---|---|---|
| Okpoyo Glory Nyong | $186,000 | Burnet Title | |
| Phelps Yeager Wade | -- | Attorney | |
| Phelps Yeager Wade | $181,000 | -- | |
| Daniel Michael | $140,225 | -- |
Source: Public Records
Mortgage History
| Date | Status | Borrower | Loan Amount |
|---|---|---|---|
| Open | Okpoyo Glory Nyong | $182,631 | |
| Previous Owner | Phelps Yeager Wade | $142,558 |
Source: Public Records
Tax History Compared to Growth
Tax History
| Year | Tax Paid | Tax Assessment Tax Assessment Total Assessment is a certain percentage of the fair market value that is determined by local assessors to be the total taxable value of land and additions on the property. | Land | Improvement |
|---|---|---|---|---|
| 2024 | $2,694 | $246,400 | $60,000 | $186,400 |
| 2023 | $2,694 | $260,700 | $78,000 | $182,700 |
| 2022 | $2,216 | $230,100 | $57,700 | $172,400 |
| 2021 | $2,160 | $193,000 | $48,000 | $145,000 |
| 2020 | $2,188 | $187,800 | $48,000 | $139,800 |
| 2019 | $1,970 | $182,600 | $42,000 | $140,600 |
| 2018 | $1,826 | $163,700 | $37,200 | $126,500 |
| 2017 | $1,642 | $155,200 | $32,500 | $122,700 |
| 2016 | $1,784 | $137,900 | $19,500 | $118,400 |
| 2015 | $1,836 | $149,600 | $25,000 | $124,600 |
| 2013 | -- | $118,000 | $19,300 | $98,700 |
Source: Public Records
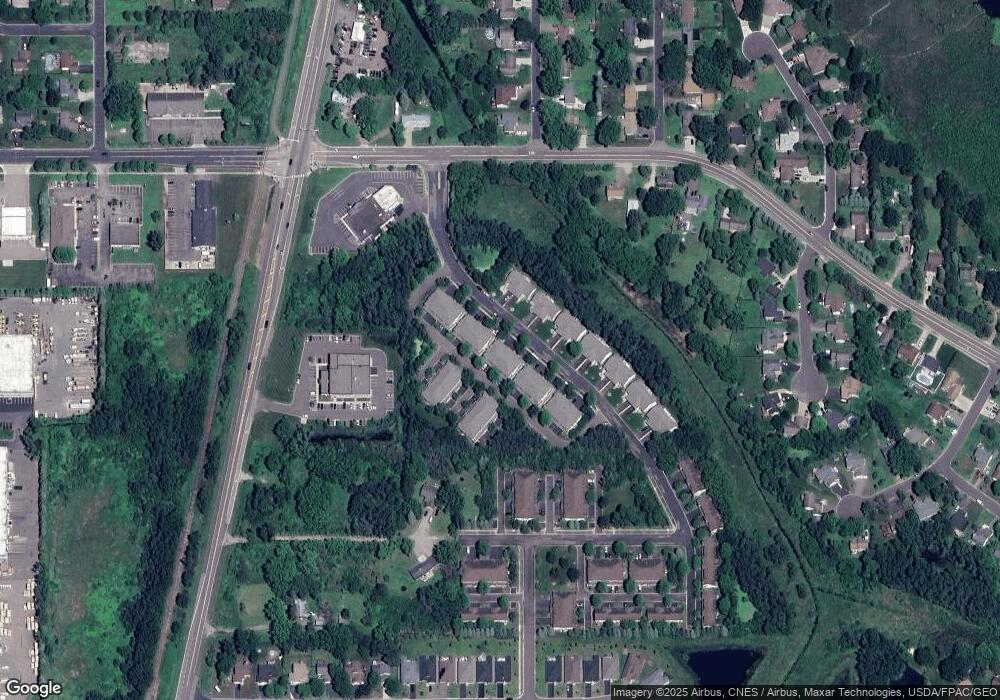
Map
Nearby Homes
- 13824 Flay Ave N
- 13744 Flay Ave N
- 6195 134th St N
- 6285 134th St N
- 5890 Freeland Alcove N
- 6270 134th St N
- 5801 Freeland Bay N
- 5910 Freeland Alcove N
- 5830 Freeland Bay N
- 5840 Freeland Bay N
- Regent Plan at Watercrest of Hugo - Heritage Collection
- 5850 Freeland Bay N
- Birchwood Plan at Watercrest of Hugo - Heritage Collection
- Augusta Plan at Watercrest of Hugo - Tradition Collection
- Somerset Plan at Watercrest of Hugo - Heritage Collection
- Wesley Plan at Watercrest of Hugo - Heritage Collection
- Weston Plan at Watercrest of Hugo - Tradition Collection
- 5820 Freeland Bay N
- Charlotte Plan at Watercrest of Hugo - Tradition Collection
- Woodbridge Plan at Watercrest of Hugo - Heritage Collection
- 13912 Flay Ave N
- 13920 Flay Ave N
- 13918 Flay Ave N
- 13914 Flay Ave N
- 13908 Flay Ave N
- 13922 Flay Ave N
- 13924 Flay Ave N
- 13910 Flay Ave N
- 13926 Flay Ave N
- 13896 Flay Ave N
- 13928 Flay Ave N
- 13930 Flay Ave N
- 13898 Flay Ave N
- 13892 Flay Ave N
- 13852 Flay Ave N
- 13894 Flay Ave N
- 13932 Flay Ave N
- 13834 Flay Ave N
- 13934 Flay Ave N
- 13919 Flay Ave N