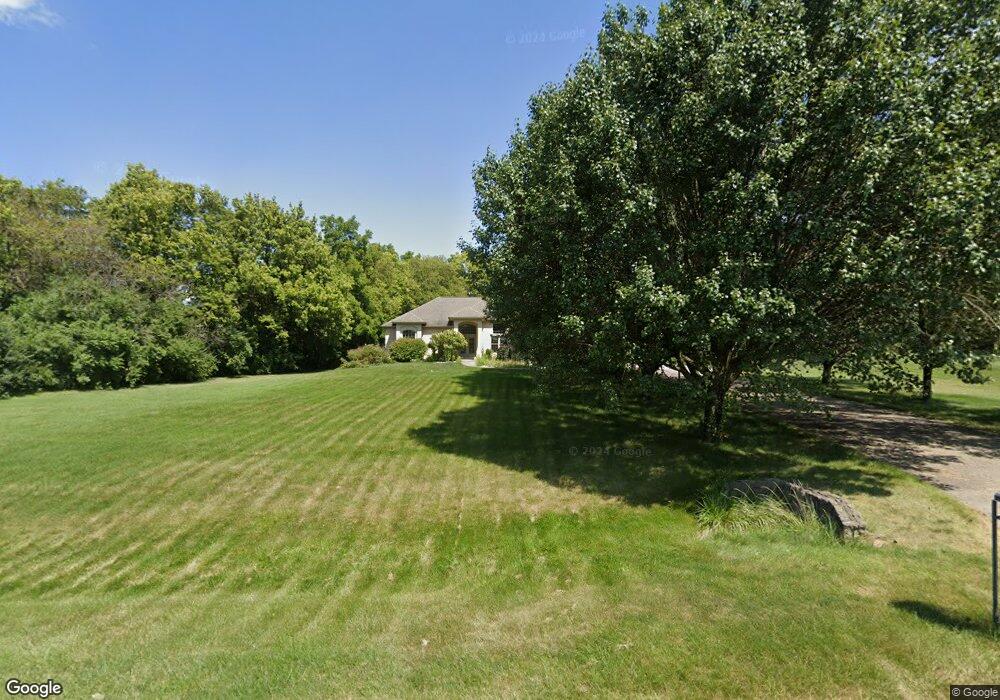
1392 Vicki Ln Lebanon, OH 45036
Clearcreek Township NeighborhoodEstimated Value: $615,501 - $710,000
3
Beds
4
Baths
2,729
Sq Ft
$247/Sq Ft
Est. Value
About This Home
This home is located at 1392 Vicki Ln, Lebanon, OH 45036 and is currently estimated at $674,375, approximately $247 per square foot. 1392 Vicki Ln is a home located in Warren County with nearby schools including Bowman Primary School, Berry Intermediate School, and Donovan Elementary School.
Ownership History
Date
Name
Owned For
Owner Type
Purchase Details
Closed on
Jul 22, 2019
Sold by
Jung Christopher Paul and Jung Timerra
Bought by
Shorts Vincient Fred and Shorts Evelyn
Current Estimated Value
Home Financials for this Owner
Home Financials are based on the most recent Mortgage that was taken out on this home.
Original Mortgage
$413,200
Outstanding Balance
$362,000
Interest Rate
3.82%
Mortgage Type
VA
Estimated Equity
$312,375
Purchase Details
Closed on
Nov 14, 2003
Sold by
Wellmeier Lawrence and Wellmeier Tracy L
Bought by
Jung Frederick and Jung Patricia M
Purchase Details
Closed on
Apr 29, 2003
Sold by
Sulfsted John E and Sulfsted Vicki L
Bought by
Jung Fred and Jung Patricia M
Home Financials for this Owner
Home Financials are based on the most recent Mortgage that was taken out on this home.
Original Mortgage
$171,700
Interest Rate
5.86%
Mortgage Type
Purchase Money Mortgage
Create a Home Valuation Report for This Property
The Home Valuation Report is an in-depth analysis detailing your home's value as well as a comparison with similar homes in the area
Home Values in the Area
Average Home Value in this Area
Purchase History
| Date | Buyer | Sale Price | Title Company |
|---|---|---|---|
| Shorts Vincient Fred | $420,000 | Prodigy Title Agency | |
| Jung Frederick | -- | -- | |
| Jung Fred | $40,000 | Fidelity Land Title |
Source: Public Records
Mortgage History
| Date | Status | Borrower | Loan Amount |
|---|---|---|---|
| Open | Shorts Vincient Fred | $413,200 | |
| Previous Owner | Jung Fred | $171,700 |
Source: Public Records
Tax History Compared to Growth
Tax History
| Year | Tax Paid | Tax Assessment Tax Assessment Total Assessment is a certain percentage of the fair market value that is determined by local assessors to be the total taxable value of land and additions on the property. | Land | Improvement |
|---|---|---|---|---|
| 2024 | $6,907 | $169,520 | $37,010 | $132,510 |
| 2023 | $6,184 | $139,279 | $21,847 | $117,432 |
| 2022 | $6,048 | $139,279 | $21,847 | $117,432 |
| 2021 | $5,830 | $139,279 | $21,847 | $117,432 |
| 2020 | $5,483 | $113,236 | $17,763 | $95,473 |
| 2019 | $4,574 | $113,236 | $17,763 | $95,473 |
| 2018 | $4,576 | $113,236 | $17,763 | $95,473 |
| 2017 | $5,057 | $112,749 | $17,626 | $95,123 |
| 2016 | $5,263 | $112,749 | $17,626 | $95,123 |
| 2015 | $5,187 | $112,749 | $17,626 | $95,123 |
| 2014 | $5,187 | $105,500 | $16,600 | $88,900 |
| 2013 | $5,185 | $110,950 | $17,370 | $93,580 |
Source: Public Records
Map
Nearby Homes
- 0 Vicki Ln Unit 926808
- Lot 5- 2.6770acres Weisenberger Rd
- 4228 Utica Rd
- 3732 Mary Ann Dr
- 2300 Pekin Rd
- 427 Old St Rt 122
- 356 Old St Rt 122
- 4904 Bunnell Hill Rd
- 133 Turner Dr
- 183 Old 122 Rd
- 4870 Bunnell Hill Rd
- 81 Grandview Dr
- 2960 Ohio 48
- 420 Fitchs Farm Ct
- 360 Summer Field Ln
- 202 Charlotte Ave
- 2733 Ohio 48
- 2722 U S 42
- 2722 N US Route 42
- 2901 Shoemaker Rd