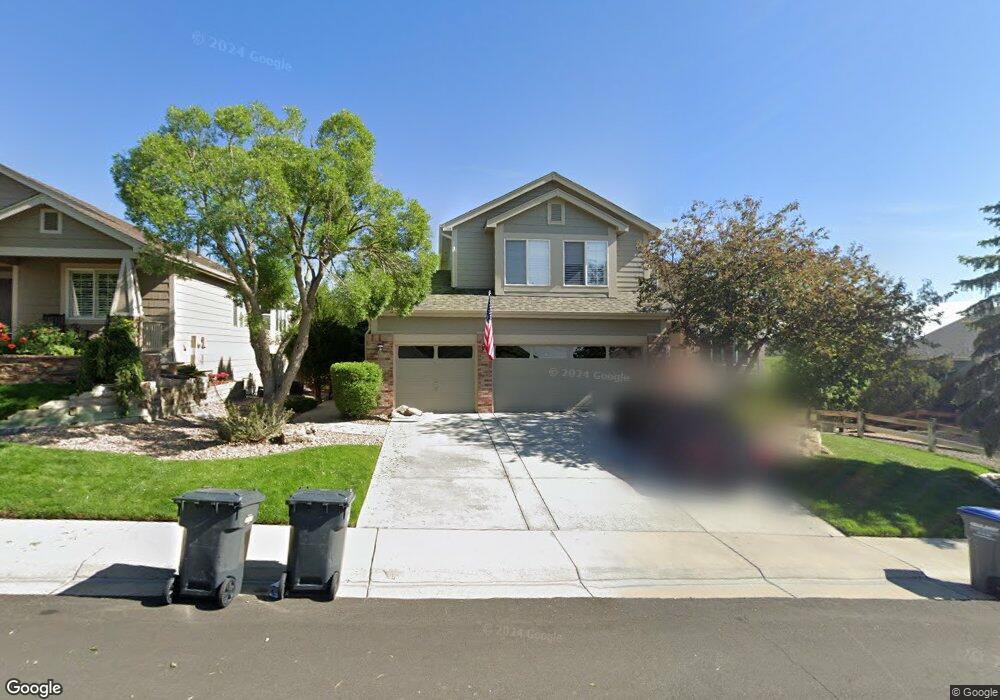
1395 Bent Grass Cir Castle Rock, CO 80109
Red Hawk NeighborhoodEstimated Value: $722,000 - $832,000
5
Beds
4
Baths
3,839
Sq Ft
$202/Sq Ft
Est. Value
About This Home
This home is located at 1395 Bent Grass Cir, Castle Rock, CO 80109 and is currently estimated at $776,149, approximately $202 per square foot. 1395 Bent Grass Cir is a home located in Douglas County with nearby schools including Clear Sky Elementary School, Castle Rock Middle School, and Castle View High School.
Ownership History
Date
Name
Owned For
Owner Type
Purchase Details
Closed on
Jun 5, 2015
Sold by
Shaw James M and Shaw Susan H
Bought by
Marquez Robert C and Marquez Laura K
Current Estimated Value
Home Financials for this Owner
Home Financials are based on the most recent Mortgage that was taken out on this home.
Original Mortgage
$437,992
Outstanding Balance
$338,630
Interest Rate
3.7%
Mortgage Type
VA
Estimated Equity
$437,519
Purchase Details
Closed on
Aug 11, 2003
Sold by
Cantrell Christopher R and Cantrell Maria C
Bought by
Shaw James M and Shaw Susan H
Home Financials for this Owner
Home Financials are based on the most recent Mortgage that was taken out on this home.
Original Mortgage
$269,600
Interest Rate
4.87%
Mortgage Type
Unknown
Purchase Details
Closed on
Nov 29, 2000
Sold by
Us Home Corp
Bought by
Cantrell Christopher R and Cantrell Marla C
Home Financials for this Owner
Home Financials are based on the most recent Mortgage that was taken out on this home.
Original Mortgage
$252,700
Interest Rate
7.84%
Create a Home Valuation Report for This Property
The Home Valuation Report is an in-depth analysis detailing your home's value as well as a comparison with similar homes in the area
Home Values in the Area
Average Home Value in this Area
Purchase History
| Date | Buyer | Sale Price | Title Company |
|---|---|---|---|
| Marquez Robert C | $424,000 | Fidelity National Title | |
| Shaw James M | $337,000 | -- | |
| Cantrell Christopher R | $287,450 | North American Title |
Source: Public Records
Mortgage History
| Date | Status | Borrower | Loan Amount |
|---|---|---|---|
| Open | Marquez Robert C | $437,992 | |
| Previous Owner | Shaw James M | $269,600 | |
| Previous Owner | Cantrell Christopher R | $252,700 | |
| Closed | Shaw James M | $33,700 |
Source: Public Records
Tax History Compared to Growth
Tax History
| Year | Tax Paid | Tax Assessment Tax Assessment Total Assessment is a certain percentage of the fair market value that is determined by local assessors to be the total taxable value of land and additions on the property. | Land | Improvement |
|---|---|---|---|---|
| 2024 | $3,296 | $51,270 | $12,370 | $38,900 |
| 2023 | $3,342 | $51,270 | $12,370 | $38,900 |
| 2022 | $2,369 | $35,550 | $9,030 | $26,520 |
| 2021 | $2,472 | $35,550 | $9,030 | $26,520 |
| 2020 | $2,322 | $34,090 | $7,850 | $26,240 |
| 2019 | $2,334 | $34,090 | $7,850 | $26,240 |
| 2018 | $2,255 | $32,120 | $6,050 | $26,070 |
| 2017 | $2,064 | $32,120 | $6,050 | $26,070 |
| 2016 | $1,963 | $29,740 | $5,760 | $23,980 |
| 2015 | $2,019 | $29,740 | $5,760 | $23,980 |
| 2014 | $1,927 | $26,050 | $5,570 | $20,480 |
Source: Public Records
Map
Nearby Homes
- 1497 Bent Grass Cir
- 1684 Marsh Hawk Cir
- 1825 Cooper Ct
- 1076 Switch Grass Dr
- 1272 Ballata Ct
- 1820 Sapling Ct
- 2347 Switch Grass Way
- 1057 Bulrush Dr
- 2204 Jute Ln
- 1492 Bergen Rock St
- 1480 Thunder Butte Rd
- 1556 Bent Wedge Point
- 1478 Bergen Rock St
- 1465 Red Cliff Way
- 1195 Melting Snow Way
- 2775 Morningbird Ln
- 2751 Keepsake Way
- 2794 Rising Moon Way
- 1108 Melting Snow Way
- 1105 Melting Snow Way
- 1429 Bent Grass Cir
- 1361 Bent Grass Cir
- 1453 Bent Grass Cir
- 1955 Rough Ct
- 1950 Rough Ct
- 1465 Bent Grass Cir
- 1958 Fringe Ct
- 1927 Rough Ct
- 1317 Bent Grass Cir
- 1923 Rough Ct
- 1921 Fringe Ct
- 1891 Rough Ct
- 1295 Bent Grass Cir
- 1895 Rough Ct
- 1511 Bent Grass Cir
- 1888 Fringe Ct
- 1851 Fringe Ct
- 1867 Rough Ct
- 1845 Fringe Ct
- 1273 Bent Grass Cir