13950 Hatfield Rd Rittman, OH 44270
Estimated Value: $216,000 - $248,000
3
Beds
1
Bath
1,632
Sq Ft
$141/Sq Ft
Est. Value
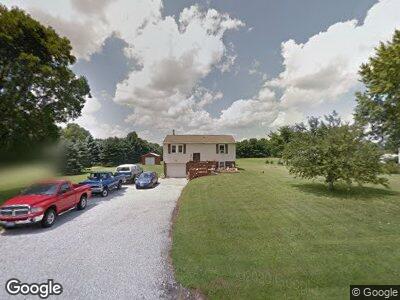
About This Home
This home is located at 13950 Hatfield Rd, Rittman, OH 44270 and is currently estimated at $230,445, approximately $141 per square foot. 13950 Hatfield Rd is a home located in Wayne County with nearby schools including Hazel Harvey Elementary School, Chippewa Intermediate School, and Chippewa Jr./Sr. High School.
Ownership History
Date
Name
Owned For
Owner Type
Purchase Details
Closed on
Jul 7, 2008
Sold by
Brown Katherine J
Bought by
Brown Michael T
Current Estimated Value
Home Financials for this Owner
Home Financials are based on the most recent Mortgage that was taken out on this home.
Original Mortgage
$118,320
Interest Rate
6.36%
Mortgage Type
New Conventional
Purchase Details
Closed on
Apr 8, 2002
Sold by
Walker Brian K
Bought by
Brown Katherine J
Home Financials for this Owner
Home Financials are based on the most recent Mortgage that was taken out on this home.
Original Mortgage
$93,875
Interest Rate
6.87%
Mortgage Type
New Conventional
Purchase Details
Closed on
Mar 15, 1994
Sold by
Walker Brian K and Walker Brenda S
Bought by
Walker Brian K
Create a Home Valuation Report for This Property
The Home Valuation Report is an in-depth analysis detailing your home's value as well as a comparison with similar homes in the area
Home Values in the Area
Average Home Value in this Area
Purchase History
| Date | Buyer | Sale Price | Title Company |
|---|---|---|---|
| Brown Michael T | $115,000 | Attorney | |
| Brown Katherine J | $95,000 | -- | |
| Walker Brian K | -- | -- |
Source: Public Records
Mortgage History
| Date | Status | Borrower | Loan Amount |
|---|---|---|---|
| Open | Brown Michael T | $55,500 | |
| Open | Brown Michael T | $85,172 | |
| Closed | Brown Michael T | $108,826 | |
| Closed | Brown Michael T | $115,377 | |
| Closed | Brown Michael T | $118,320 | |
| Previous Owner | Brown Katherine J | $10,950 | |
| Previous Owner | Brown Katherine J | $93,875 |
Source: Public Records
Tax History Compared to Growth
Tax History
| Year | Tax Paid | Tax Assessment Tax Assessment Total Assessment is a certain percentage of the fair market value that is determined by local assessors to be the total taxable value of land and additions on the property. | Land | Improvement |
|---|---|---|---|---|
| 2024 | $2,327 | $66,680 | $23,770 | $42,910 |
| 2023 | $2,327 | $66,680 | $23,770 | $42,910 |
| 2022 | $1,735 | $45,670 | $16,280 | $29,390 |
| 2021 | $1,746 | $45,670 | $16,280 | $29,390 |
| 2020 | $1,758 | $45,670 | $16,280 | $29,390 |
| 2019 | $1,504 | $37,720 | $14,860 | $22,860 |
| 2018 | $1,519 | $37,720 | $14,860 | $22,860 |
| 2017 | $1,484 | $37,720 | $14,860 | $22,860 |
| 2016 | $1,468 | $36,270 | $14,290 | $21,980 |
| 2015 | $1,462 | $36,270 | $14,290 | $21,980 |
| 2014 | $1,143 | $32,340 | $14,290 | $18,050 |
| 2013 | $1,222 | $31,900 | $13,660 | $18,240 |
Source: Public Records
Map
Nearby Homes
- 13270 Doylestown Rd
- 12960 Elizabeth Trail
- 0 E Ohio Ave Unit 3 5118661
- 0 E Ohio Ave Unit 5118655
- 65 N Seneca St
- 123 N Seneca St
- 15144 Mount Eaton Rd
- 188 N Seneca St
- 166 S Main St
- 178 N State St
- 14604 Doylestown Rd
- 0 Mount Eaton Rd N
- 84 Ganyard St
- 355 N Main St
- 88 Home St
- 78 N 4th St
- 14301 Galehouse Rd
- 157 Louise St
- 145 Maplewood Ave
- 10303 Mount Eaton Rd
- 13950 Hatfield Rd
- 13932 Hatfield Rd
- 13966 Hatfield Rd
- 13969 Hatfield Rd
- 13883 Hatfield Rd
- 13892 Hatfield Rd
- 13991 Hatfield Rd
- 13942 Hatfield Rd
- 13868 Hatfield Rd
- 14004 Hatfield Rd
- 12597 Sheets Rd
- 13862 Hatfield Rd
- 14017 Hatfield Rd
- 13863 Hatfield Rd
- 12534 Sheets Rd
- 14053 Hatfield Rd
- 12471 Sheets Rd
- 13830 Hatfield Rd
- 13979 Hatfield Rd
- 12590 Sheets Rd