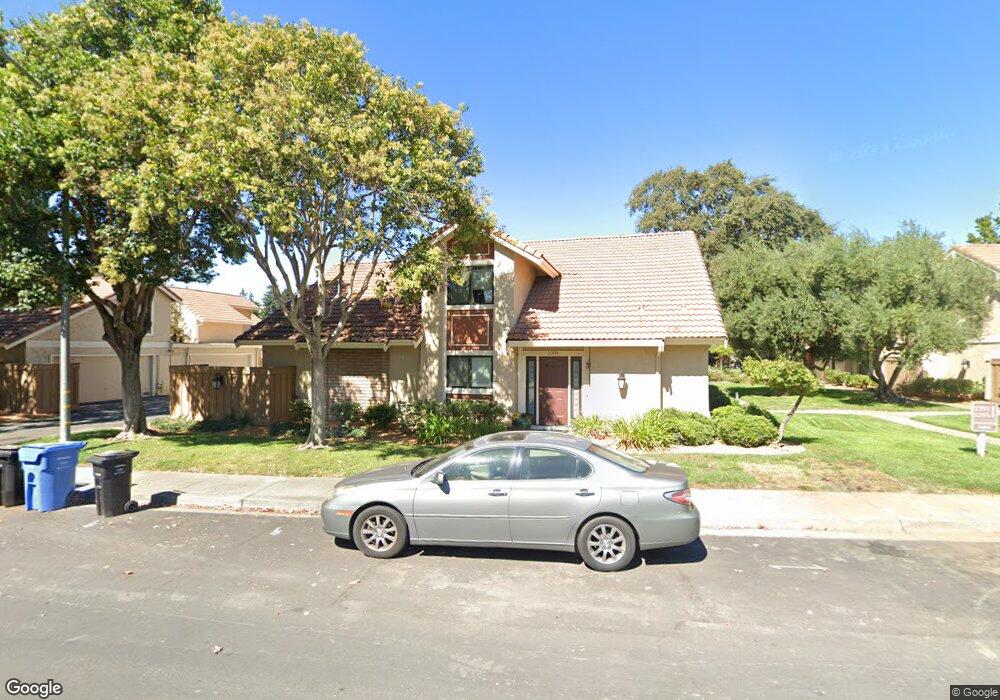
1399 Candelero Dr Walnut Creek, CA 94598
Contra Costa Centre NeighborhoodEstimated Value: $830,000 - $853,000
3
Beds
3
Baths
1,683
Sq Ft
$499/Sq Ft
Est. Value
About This Home
This home is located at 1399 Candelero Dr, Walnut Creek, CA 94598 and is currently estimated at $840,380, approximately $499 per square foot. 1399 Candelero Dr is a home located in Contra Costa County with nearby schools including Bancroft Elementary School, Foothill Middle School, and Northgate High School.
Ownership History
Date
Name
Owned For
Owner Type
Purchase Details
Closed on
Mar 27, 2012
Sold by
Martarella Anthony and Levin Ronnie
Bought by
Lee Choo Beng
Current Estimated Value
Purchase Details
Closed on
Jul 29, 2010
Sold by
Martarella Anthony and Levin Ronnie
Bought by
Martarella Anthony and Levin Ronnie
Purchase Details
Closed on
Jan 8, 2008
Sold by
Levin Ronnie
Bought by
Martarella Anthony and Levin Ronnie
Purchase Details
Closed on
Jun 8, 1999
Sold by
Johnson Marus M
Bought by
Levin Ronnie
Home Financials for this Owner
Home Financials are based on the most recent Mortgage that was taken out on this home.
Original Mortgage
$125,000
Interest Rate
3.95%
Mortgage Type
Purchase Money Mortgage
Purchase Details
Closed on
May 14, 1999
Sold by
Benson Richard B
Bought by
Levin Ronnie
Home Financials for this Owner
Home Financials are based on the most recent Mortgage that was taken out on this home.
Original Mortgage
$125,000
Interest Rate
3.95%
Mortgage Type
Purchase Money Mortgage
Create a Home Valuation Report for This Property
The Home Valuation Report is an in-depth analysis detailing your home's value as well as a comparison with similar homes in the area
Home Values in the Area
Average Home Value in this Area
Purchase History
| Date | Buyer | Sale Price | Title Company |
|---|---|---|---|
| Lee Choo Beng | $416,000 | Fidelity National Title Co | |
| Martarella Anthony | -- | None Available | |
| Martarella Anthony | -- | None Available | |
| Levin Ronnie | $298,000 | Placer Title Company | |
| Levin Ronnie | -- | Placer Title |
Source: Public Records
Mortgage History
| Date | Status | Borrower | Loan Amount |
|---|---|---|---|
| Previous Owner | Levin Ronnie | $125,000 |
Source: Public Records
Tax History Compared to Growth
Tax History
| Year | Tax Paid | Tax Assessment Tax Assessment Total Assessment is a certain percentage of the fair market value that is determined by local assessors to be the total taxable value of land and additions on the property. | Land | Improvement |
|---|---|---|---|---|
| 2025 | $6,484 | $522,506 | $281,351 | $241,155 |
| 2024 | $6,373 | $512,262 | $275,835 | $236,427 |
| 2023 | $6,373 | $502,219 | $270,427 | $231,792 |
| 2022 | $6,318 | $492,373 | $265,125 | $227,248 |
| 2021 | $6,173 | $482,720 | $259,927 | $222,793 |
| 2019 | $6,025 | $468,404 | $252,218 | $216,186 |
| 2018 | $5,806 | $459,221 | $247,273 | $211,948 |
| 2017 | $5,616 | $450,218 | $242,425 | $207,793 |
| 2016 | $5,475 | $441,391 | $237,672 | $203,719 |
| 2015 | $5,427 | $434,761 | $234,102 | $200,659 |
| 2014 | $5,347 | $426,246 | $229,517 | $196,729 |
Source: Public Records
Map
Nearby Homes
- 1836 Pomar Way
- 1053 Northoak Dr
- 1060 Sheppard Rd
- 100 Alderwood Rd
- 190 Alderwood Rd
- 1605 Countrywood Ct
- 1909 Countrywood Ct
- 1839 Stratton Cir
- 1628 Countrywood Ct
- 208 Siskiyou Ct
- 1919 Ygnacio Valley Rd Unit 71
- 1513 Siskiyou Dr
- 2716 Oak Rd Unit 117
- 2716 Oak Rd Unit 111
- 347 Kinross Dr
- 2724 Oak Rd Unit 88
- 2365 Shannon Ln
- 2704 Oak Rd Unit 80
- 2712 Oak Rd Unit 57
- 2712 Oak Rd Unit 60
- 1395 Candelero Dr
- 1391 Candelero Dr
- 1425 Candelero Dr
- 1379 Candelero Dr
- 1387 Candelero Dr
- 1429 Candelero Dr
- 1383 Candelero Dr
- 1402 Candelero Dr
- 1398 Candelero Dr
- 1433 Candelero Dr
- 1422 Candelero Dr
- 1406 Candelero Dr
- 1394 Candelero Dr
- 1375 Candelero Dr
- 1371 Candelero Dr
- 1410 Candelero Dr
- 1418 Candelero Dr
- 1414 Candelero Dr
- 1378 Candelero Dr
- 1390 Candelero Dr