
Landlord's Agent in 2024
Mark Jones
PMI Midwest
(463) 207-9326
134 Total Sales
Estimated Value: $265,816 - $276,000
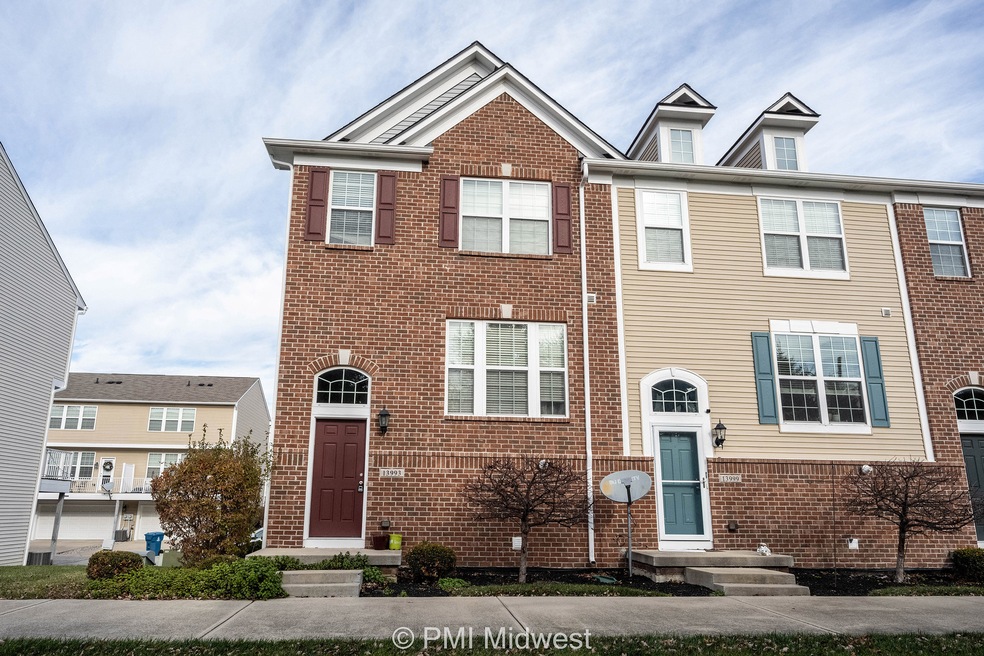
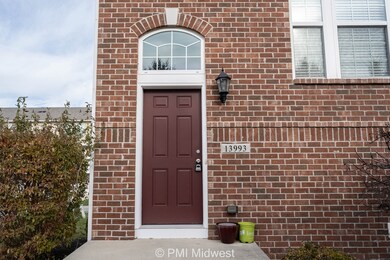
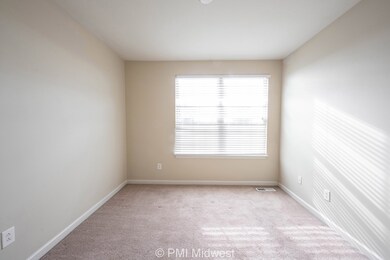
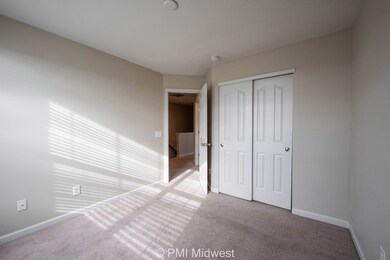
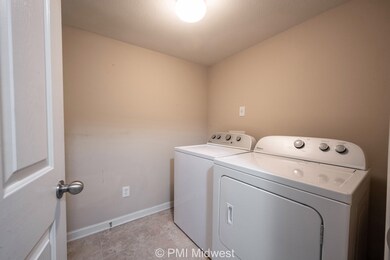
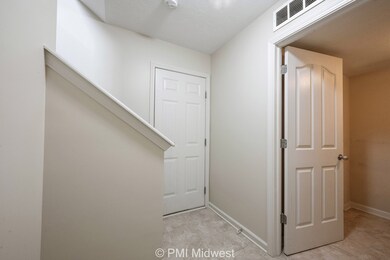
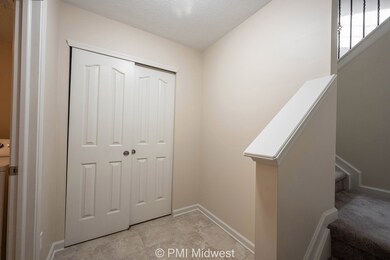
Infused with the charm of a cozy cottage and the modern amenities of a luxury home, 13993 Wimbleton Way in Fishers, IN is a 3-bedroom, 2.5-bathroom property that boasts 1540 sq ft of comfortable living space. This stunning rental offers an inviting open floor plan with abundant natural light, creating a warm and welcoming atmosphere. The spacious kitchen is equipped with high-end appliances and sleek countertops, perfect for preparing delicious meals. The master suite features a spa-like en-suite bathroom and ample closet space, providing a relaxing retreat. The beautifully landscaped backyard is ideal for outdoor entertaining and relaxation. Conveniently located near top-rated schools, shopping, and dining, this property offers the perfect blend of convenience and luxury. Don't miss the opportunity to make this exquisite rental your new home sweet home. Book a showing today!
Last Agent to Rent the Property
PMI Midwest Brokerage Email: jsibol@midwestpmi.com License #RB14036355 Listed on: 12/01/2023
Last Renter's Agent
PMI Midwest Brokerage Email: jsibol@midwestpmi.com License #RB14036355 Listed on: 12/01/2023
| Date | Buyer | Sale Price | Title Company |
|---|---|---|---|
| Das Srinibas | -- | None Available |
| Date | Status | Borrower | Loan Amount |
|---|---|---|---|
| Open | Das Srinibas | $138,420 |
| Date | Event | Price | List to Sale | Price per Sq Ft | Prior Sale |
|---|---|---|---|---|---|
| 02/27/2024 02/27/24 | Rented | $1,749 | 0.0% | -- | |
| 12/22/2023 12/22/23 | Price Changed | $1,749 | -2.3% | $1 / Sq Ft | |
| 12/01/2023 12/01/23 | For Rent | $1,790 | +8.6% | -- | |
| 01/05/2023 01/05/23 | Rented | $1,649 | -3.0% | -- | |
| 09/15/2022 09/15/22 | For Rent | $1,700 | +21.4% | -- | |
| 04/24/2020 04/24/20 | Rented | $1,400 | 0.0% | -- | |
| 04/01/2020 04/01/20 | Under Contract | -- | -- | -- | |
| 03/26/2020 03/26/20 | For Rent | $1,400 | 0.0% | -- | |
| 03/31/2015 03/31/15 | Sold | $153,800 | -5.3% | $105 / Sq Ft | View Prior Sale |
| 01/31/2015 01/31/15 | Pending | -- | -- | -- | |
| 01/08/2015 01/08/15 | Price Changed | $162,345 | +1.3% | $111 / Sq Ft | |
| 12/16/2014 12/16/14 | Price Changed | $160,195 | +2.3% | $109 / Sq Ft | |
| 12/03/2014 12/03/14 | Price Changed | $156,645 | +3.1% | $107 / Sq Ft | |
| 12/03/2014 12/03/14 | For Sale | $152,000 | -- | $104 / Sq Ft |
| Year | Tax Paid | Tax Assessment Tax Assessment Total Assessment is a certain percentage of the fair market value that is determined by local assessors to be the total taxable value of land and additions on the property. | Land | Improvement |
|---|---|---|---|---|
| 2024 | $4,646 | $231,500 | $33,600 | $197,900 |
| 2023 | $4,646 | $214,400 | $33,600 | $180,800 |
| 2022 | $3,820 | $189,900 | $33,600 | $156,300 |
| 2021 | $3,820 | $167,600 | $33,600 | $134,000 |
| 2020 | $1,631 | $156,700 | $33,600 | $123,100 |
| 2019 | $1,619 | $155,400 | $31,000 | $124,400 |
| 2018 | $1,482 | $146,200 | $31,000 | $115,200 |
| 2017 | $1,454 | $145,400 | $31,000 | $114,400 |
| 2016 | $1,382 | $141,100 | $31,000 | $110,100 |
| 2014 | $13 | $600 | $600 | $0 |
Landlord's Agent in 2024
Mark Jones
PMI Midwest
(463) 207-9326
134 Total Sales
Seller's Agent in 2015
Mike Scheetz
CENTURY 21 Scheetz
(317) 587-8600
49 in this area
705 Total Sales
M
Seller Co-Listing Agent in 2015
Melanie Scheetz
CENTURY 21 Scheetz
(317) 587-8600
18 in this area
177 Total Sales
N
Buyer's Agent in 2015
Non-BLC Member
MIBOR REALTOR® Association
I
Buyer's Agent in 2015
IUO Non-BLC Member
Non-BLC Office
Source: MIBOR Broker Listing Cooperative®
MLS Number: 21955384
APN: 29-11-25-019-043.000-020
Disclaimer: Certain information contained herein is derived from information provided by parties other than Homes.com. All information provided is deemed reliable, but is not guaranteed to be accurate and should be independently verified.
![]() Based on information submitted to the MLS GRID. All data is obtained from various sources and may not have been verified by broker or MLS GRID. Supplied Open House Information is subject to change without notice. All information should be independently reviewed and verified for accuracy. Properties may or may not be listed by the office/agent presenting the information. Some IDX listings have been excluded from this website.
Based on information submitted to the MLS GRID. All data is obtained from various sources and may not have been verified by broker or MLS GRID. Supplied Open House Information is subject to change without notice. All information should be independently reviewed and verified for accuracy. Properties may or may not be listed by the office/agent presenting the information. Some IDX listings have been excluded from this website.