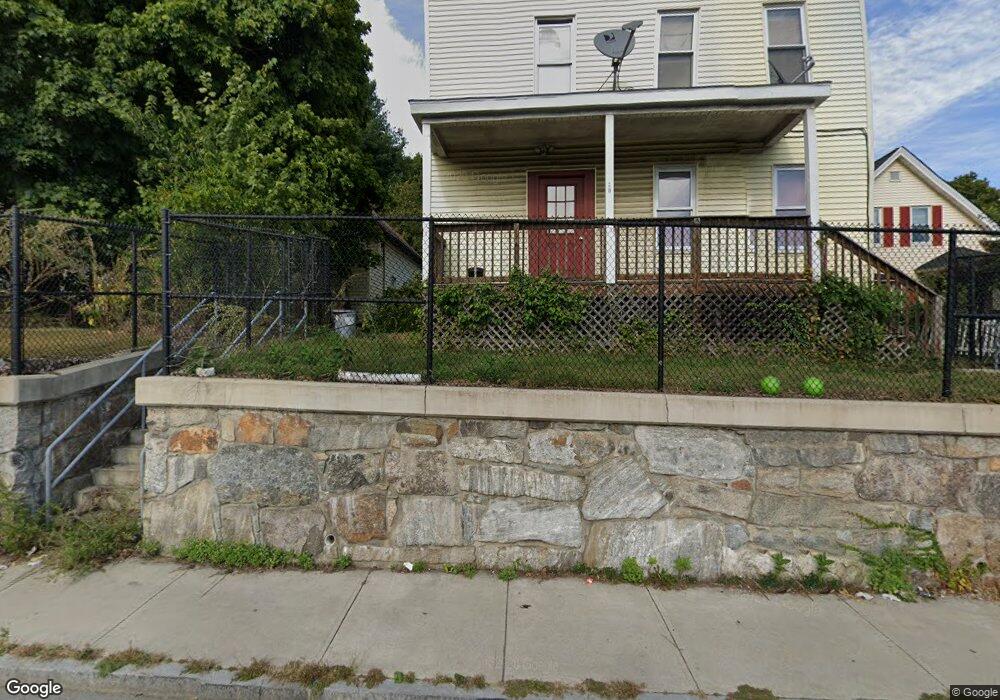
14 Burton Ct Worcester, MA 01607
Vernon Hill NeighborhoodEstimated Value: $334,039 - $367,000
4
Beds
1
Bath
1,110
Sq Ft
$317/Sq Ft
Est. Value
About This Home
This home is located at 14 Burton Ct, Worcester, MA 01607 and is currently estimated at $351,510, approximately $316 per square foot. 14 Burton Ct is a home located in Worcester County with nearby schools including Vernon Hill Elementary School, Jacob Hiatt Magnet School, and Chandler Magnet.
Ownership History
Date
Name
Owned For
Owner Type
Purchase Details
Closed on
Oct 31, 2024
Sold by
Febo Nydia L
Bought by
Colon Febo Ft and Colon
Current Estimated Value
Purchase Details
Closed on
Sep 21, 2009
Sold by
Luu Joe
Bought by
Febo Nydia L
Home Financials for this Owner
Home Financials are based on the most recent Mortgage that was taken out on this home.
Original Mortgage
$3,466
Interest Rate
5.14%
Purchase Details
Closed on
May 28, 2009
Sold by
American Home Mtg Svcs and Deutsche Bank Natl T C
Bought by
Luu Joe
Purchase Details
Closed on
Dec 5, 2008
Sold by
Gardner James M and Deutsche Bank Natl T C
Bought by
Deutsche Bank Natl T C
Purchase Details
Closed on
Jan 30, 2004
Sold by
Gurnick Joseph P and Shields June C
Bought by
Gardner James M
Create a Home Valuation Report for This Property
The Home Valuation Report is an in-depth analysis detailing your home's value as well as a comparison with similar homes in the area
Home Values in the Area
Average Home Value in this Area
Purchase History
We collect this data history from publicly available records. To have your information removed, we recommend requesting removal directly through your county’s website.
| Date | Buyer | Sale Price | Title Company |
|---|---|---|---|
| Colon Febo Ft | -- | None Available | |
| Colon Febo Ft | -- | None Available | |
| Febo Nydia L | $115,550 | -- | |
| Luu Joe | $43,000 | -- | |
| Deutsche Bank Natl T C | $157,500 | -- | |
| Gardner James M | $150,000 | -- | |
| Febo Nydia L | $115,550 | -- | |
| Luu Joe | $43,000 | -- | |
| Deutsche Bank Natl T C | $157,500 | -- | |
| Gardner James M | $150,000 | -- |
Source: Public Records
Mortgage History
We collect this data history from publicly available records. To have your information removed, we recommend requesting removal directly through your county’s website.
| Date | Status | Borrower | Loan Amount |
|---|---|---|---|
| Previous Owner | Gardner James M | $4,252 | |
| Previous Owner | Gardner James M | $3,466 | |
| Previous Owner | Febo Nydia L | $88,973 | |
| Previous Owner | Gardner James M | $23,110 |
Source: Public Records
Tax History
| Year | Tax Paid | Tax Assessment Tax Assessment Total Assessment is a certain percentage of the fair market value that is determined by local assessors to be the total taxable value of land and additions on the property. | Land | Improvement |
|---|---|---|---|---|
| 2025 | $3,365 | $255,100 | $55,700 | $199,400 |
| 2024 | $3,187 | $231,800 | $55,700 | $176,100 |
| 2023 | $3,082 | $214,900 | $48,400 | $166,500 |
| 2022 | $2,864 | $188,300 | $38,700 | $149,600 |
| 2021 | $2,746 | $168,700 | $31,000 | $137,700 |
| 2020 | $2,586 | $152,100 | $30,800 | $121,300 |
| 2019 | $2,468 | $137,100 | $26,800 | $110,300 |
| 2018 | $2,449 | $129,500 | $26,800 | $102,700 |
| 2017 | $2,326 | $121,000 | $26,800 | $94,200 |
| 2016 | $2,380 | $115,500 | $20,400 | $95,100 |
| 2015 | $2,318 | $115,500 | $20,400 | $95,100 |
| 2014 | $2,257 | $115,500 | $20,400 | $95,100 |
Source: Public Records
Map
Nearby Homes
- 659 Millbury St
- 665 Millbury St
- 661 Millbury St
- 661 Millbury St Unit 2
- 661 Millbury St Unit 3
- 661 Millbury St Unit 1
- 669 Millbury St
- 657 Millbury St
- 12 Burton Ct
- 10 Burton Ct
- 671 Millbury St
- 5 Esther St
- 7 Esther St
- 9 Esther St
- 3 Esther St
- 4 Burton Ct
- 675 Millbury St
- 647 Millbury St
- 11 Esther St
- 1 Burton St
Your Personal Tour Guide
Ask me questions while you tour the home.