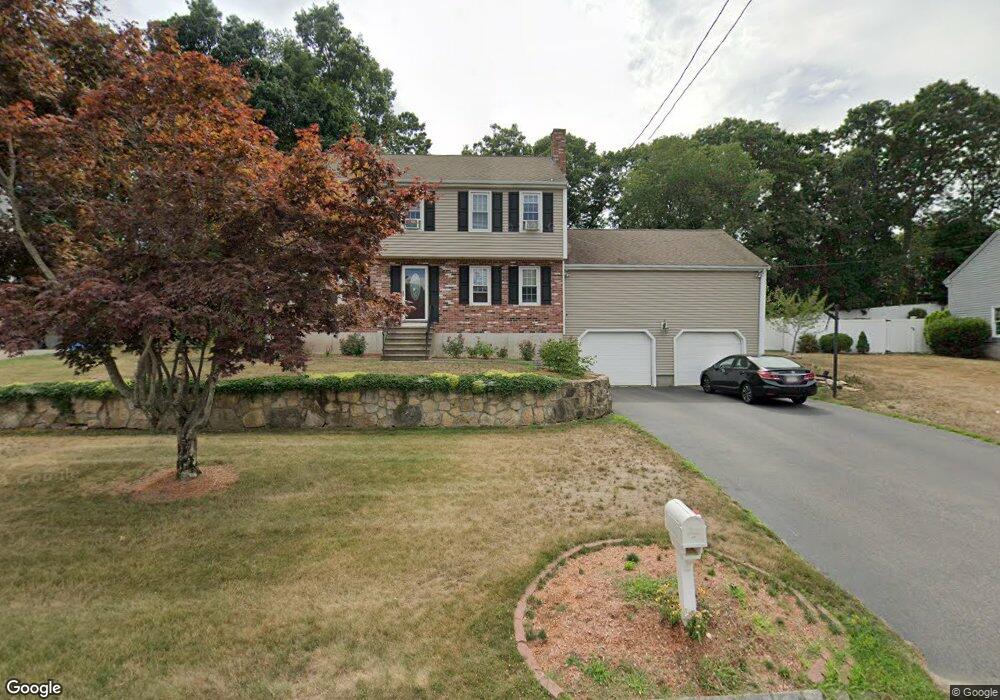
14 Carp Rd Milford, MA 01757
Estimated Value: $664,000 - $720,000
4
Beds
3
Baths
2,131
Sq Ft
$320/Sq Ft
Est. Value
About This Home
This home is located at 14 Carp Rd, Milford, MA 01757 and is currently estimated at $682,345, approximately $320 per square foot. 14 Carp Rd is a home located in Worcester County with nearby schools including Milford High School.
Ownership History
Date
Name
Owned For
Owner Type
Purchase Details
Closed on
Jan 25, 2019
Sold by
Vo Kelly and Huynh Thu
Bought by
Huynh Thu
Current Estimated Value
Home Financials for this Owner
Home Financials are based on the most recent Mortgage that was taken out on this home.
Original Mortgage
$185,000
Outstanding Balance
$161,331
Interest Rate
4.5%
Mortgage Type
New Conventional
Estimated Equity
$521,014
Purchase Details
Closed on
Aug 15, 2006
Sold by
Hall Deborah A and Hall Richard B
Bought by
Vo Kelly and Huynh Thu
Home Financials for this Owner
Home Financials are based on the most recent Mortgage that was taken out on this home.
Original Mortgage
$372,000
Interest Rate
6.8%
Mortgage Type
Purchase Money Mortgage
Create a Home Valuation Report for This Property
The Home Valuation Report is an in-depth analysis detailing your home's value as well as a comparison with similar homes in the area
Home Values in the Area
Average Home Value in this Area
Purchase History
| Date | Buyer | Sale Price | Title Company |
|---|---|---|---|
| Huynh Thu | -- | -- | |
| Vo Kelly | $465,000 | -- | |
| Vo Kelly | $465,000 | -- |
Source: Public Records
Mortgage History
| Date | Status | Borrower | Loan Amount |
|---|---|---|---|
| Open | Huynh Thu | $185,000 | |
| Previous Owner | Vo Kelly | $372,000 | |
| Previous Owner | Vo Kelly | $153,000 |
Source: Public Records
Tax History
| Year | Tax Paid | Tax Assessment Tax Assessment Total Assessment is a certain percentage of the fair market value that is determined by local assessors to be the total taxable value of land and additions on the property. | Land | Improvement |
|---|---|---|---|---|
| 2025 | $7,282 | $568,900 | $191,300 | $377,600 |
| 2024 | $7,208 | $542,400 | $183,700 | $358,700 |
| 2023 | $6,816 | $471,700 | $158,800 | $312,900 |
| 2022 | $6,421 | $417,200 | $145,400 | $271,800 |
| 2021 | $6,125 | $383,300 | $145,400 | $237,900 |
| 2020 | $6,052 | $379,200 | $145,400 | $233,800 |
| 2019 | $5,892 | $356,200 | $145,400 | $210,800 |
| 2018 | $5,773 | $348,600 | $141,600 | $207,000 |
| 2017 | $5,608 | $334,000 | $141,600 | $192,400 |
| 2016 | $5,525 | $321,600 | $141,600 | $180,000 |
| 2015 | $5,400 | $307,700 | $133,900 | $173,800 |
Source: Public Records
Map
Nearby Homes
- 23 Clark St
- 190-194 E Main St
- 78 Fisher St
- 15 Fox Run Rd
- 22 Granite St
- 35 Woodland Ave Unit 35A
- 16 Oak Tree Dr
- 15 Black Bear Cir Unit 15
- 13 Black Bear Cir Unit 13
- 11 Black Bear Unit 11
- 99-101 E Main St
- 9 Black Bear Cir Unit 9
- 7 Black Bear Unit 7
- 10 Black Bear Unit 10
- 6 Jen Paul Way Unit B
- 43 Black Bear Cir Unit 43
- 46 Black Bear Cir Unit 46
- 8 Black Bear Cir Unit 8
- 48 Black Bear Cir Unit 48
- 3 Columbus Ave