14 Cattail Loop Shapleigh, ME 04076
Shapleigh NeighborhoodEstimated Value: $373,570
1
Bed
1
Bath
572
Sq Ft
$653/Sq Ft
Est. Value
About This Home
This home is located at 14 Cattail Loop, Shapleigh, ME 04076 and is currently estimated at $373,570, approximately $653 per square foot. 14 Cattail Loop is a home located in York County with nearby schools including Massabesic High School.
Ownership History
Date
Name
Owned For
Owner Type
Purchase Details
Closed on
May 28, 2010
Sold by
Demers Cindy E and Demers Gerald A
Bought by
Turgeon Amy B and Turgeon William E
Current Estimated Value
Home Financials for this Owner
Home Financials are based on the most recent Mortgage that was taken out on this home.
Original Mortgage
$134,320
Outstanding Balance
$90,725
Interest Rate
5.13%
Mortgage Type
FHA
Estimated Equity
$282,845
Purchase Details
Closed on
Oct 28, 2005
Sold by
North Country Land Inc
Bought by
Turgeon Amy B and Turgeon William E
Create a Home Valuation Report for This Property
The Home Valuation Report is an in-depth analysis detailing your home's value as well as a comparison with similar homes in the area
Home Values in the Area
Average Home Value in this Area
Purchase History
| Date | Buyer | Sale Price | Title Company |
|---|---|---|---|
| Turgeon Amy B | -- | -- | |
| Turgeon Amy B | -- | -- |
Source: Public Records
Mortgage History
| Date | Status | Borrower | Loan Amount |
|---|---|---|---|
| Open | Turgeon Amy B | $134,320 | |
| Previous Owner | Turgeon Amy B | $101,000 |
Source: Public Records
Tax History Compared to Growth
Tax History
| Year | Tax Paid | Tax Assessment Tax Assessment Total Assessment is a certain percentage of the fair market value that is determined by local assessors to be the total taxable value of land and additions on the property. | Land | Improvement |
|---|---|---|---|---|
| 2024 | $4,103 | $340,519 | $231,002 | $109,517 |
| 2023 | $3,610 | $340,519 | $231,002 | $109,517 |
| 2022 | $3,507 | $340,519 | $231,002 | $109,517 |
| 2021 | $3,490 | $340,519 | $231,002 | $109,517 |
| 2020 | $3,490 | $340,519 | $231,002 | $109,517 |
| 2019 | $3,456 | $340,519 | $231,002 | $109,517 |
| 2018 | $2,952 | $267,158 | $198,678 | $68,480 |
| 2017 | $2,853 | $267,158 | $198,678 | $68,480 |
| 2016 | $2,752 | $267,158 | $198,678 | $68,480 |
| 2015 | $2,529 | $252,927 | $198,678 | $54,249 |
| 2014 | $2,441 | $252,927 | $198,678 | $54,249 |
Source: Public Records
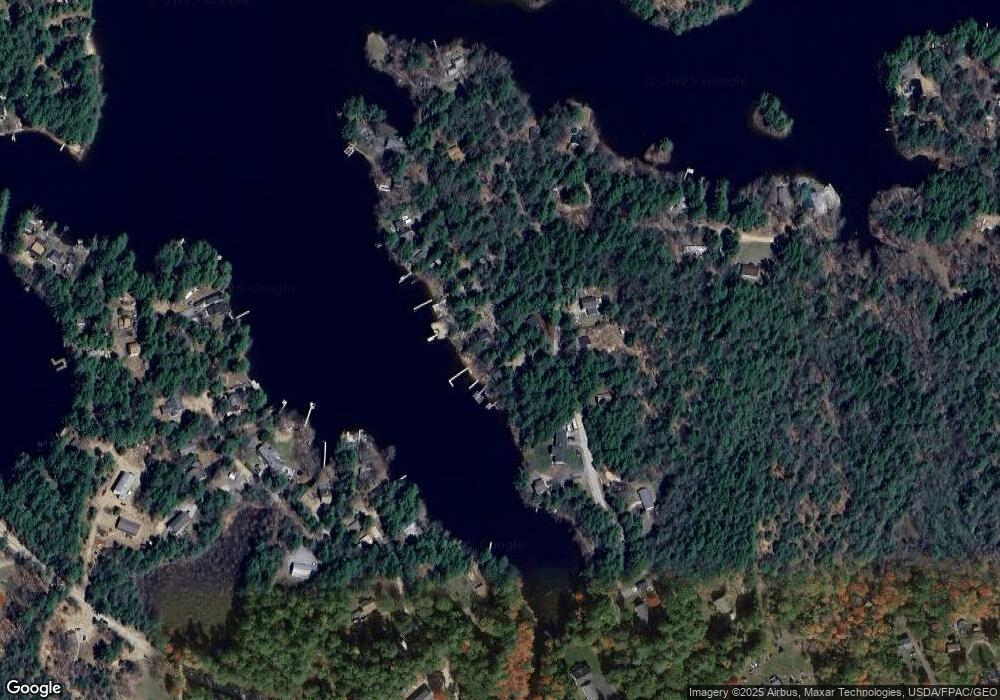
Map
Nearby Homes