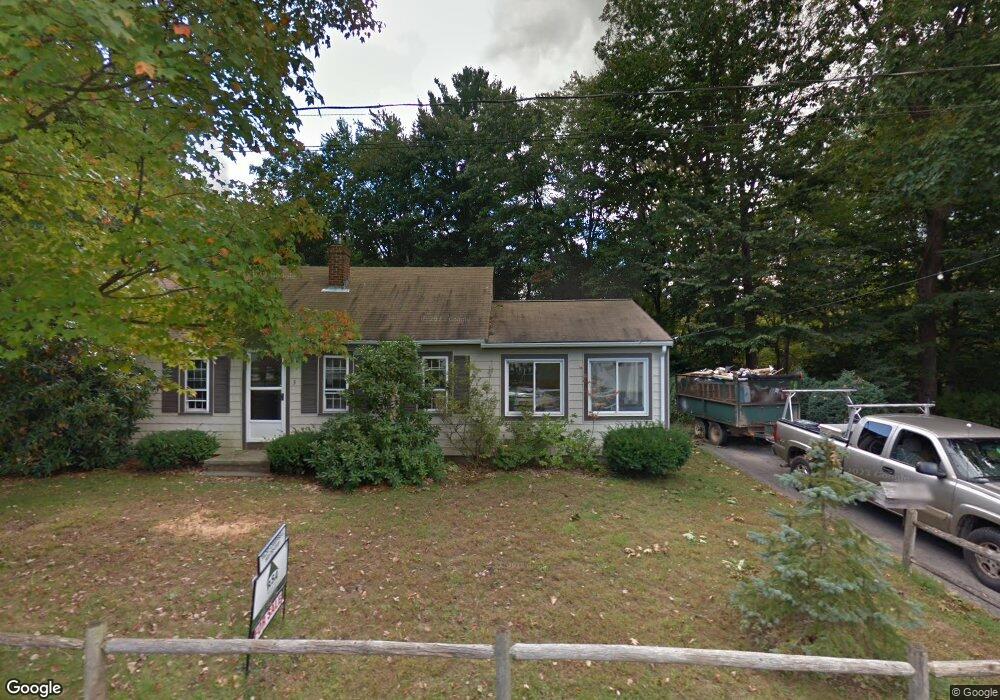
14 Coleman St Rochester, NH 03867
Estimated Value: $392,000 - $456,000
3
Beds
2
Baths
1,152
Sq Ft
$370/Sq Ft
Est. Value
About This Home
This home is located at 14 Coleman St, Rochester, NH 03867 and is currently estimated at $426,539, approximately $370 per square foot. 14 Coleman St is a home located in Strafford County with nearby schools including William Allen School, Rochester Middle School, and Spaulding High School.
Ownership History
Date
Name
Owned For
Owner Type
Purchase Details
Closed on
Jan 24, 2013
Sold by
Acorn Rt and Sands David S
Bought by
Gallop Carrie L
Current Estimated Value
Purchase Details
Closed on
Jun 15, 2012
Sold by
Barry Judith C and Meetcalf Robert A
Bought by
Acorn Rt and Sands David S
Create a Home Valuation Report for This Property
The Home Valuation Report is an in-depth analysis detailing your home's value as well as a comparison with similar homes in the area
Home Values in the Area
Average Home Value in this Area
Purchase History
| Date | Buyer | Sale Price | Title Company |
|---|---|---|---|
| Gallop Carrie L | $170,500 | -- | |
| Gallop Carrie L | $170,500 | -- | |
| Acorn Rt | $82,000 | -- | |
| Acorn Rt | $82,000 | -- |
Source: Public Records
Mortgage History
| Date | Status | Borrower | Loan Amount |
|---|---|---|---|
| Previous Owner | Acorn Rt | $115,296 | |
| Previous Owner | Acorn Rt | $6,526 | |
| Closed | Acorn Rt | $0 |
Source: Public Records
Tax History Compared to Growth
Tax History
| Year | Tax Paid | Tax Assessment Tax Assessment Total Assessment is a certain percentage of the fair market value that is determined by local assessors to be the total taxable value of land and additions on the property. | Land | Improvement |
|---|---|---|---|---|
| 2024 | $5,581 | $375,800 | $120,300 | $255,500 |
| 2023 | $5,704 | $221,600 | $71,200 | $150,400 |
| 2022 | $5,602 | $221,600 | $71,200 | $150,400 |
| 2021 | $5,462 | $221,600 | $71,200 | $150,400 |
| 2020 | $5,454 | $221,600 | $71,200 | $150,400 |
| 2019 | $5,518 | $221,600 | $71,200 | $150,400 |
| 2018 | $5,697 | $207,000 | $41,400 | $165,600 |
| 2017 | $5,450 | $207,000 | $41,400 | $165,600 |
| 2016 | $4,852 | $171,700 | $41,400 | $130,300 |
| 2015 | $4,833 | $171,700 | $41,400 | $130,300 |
| 2014 | $4,717 | $171,700 | $41,400 | $130,300 |
| 2013 | $4,703 | $178,400 | $55,100 | $123,300 |
| 2012 | $4,581 | $178,400 | $55,100 | $123,300 |
Source: Public Records
Map
Nearby Homes