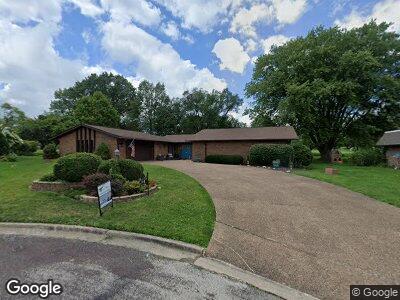
14 Cypress Point Cul-De-sac Pekin, IL 61554
North of Broadway NeighborhoodEstimated Value: $303,000 - $313,000
3
Beds
2
Baths
2,409
Sq Ft
$128/Sq Ft
Est. Value
About This Home
This home is located at 14 Cypress Point Cul-De-sac, Pekin, IL 61554 and is currently estimated at $308,428, approximately $128 per square foot. 14 Cypress Point Cul-De-sac is a home located in Tazewell County with nearby schools including L E Starke Elementary School, Washington Intermediate School, and Edison Junior High School.
Ownership History
Date
Name
Owned For
Owner Type
Purchase Details
Closed on
Nov 30, 2021
Sold by
Speerly Cathy L
Bought by
Speerly Cathy L and Zuch Denia
Current Estimated Value
Purchase Details
Closed on
Sep 23, 2020
Sold by
Smith Lyle E and Smith Doris J
Bought by
Speerly Cathy L
Purchase Details
Closed on
Aug 24, 2018
Sold by
Alexander Fredric L and Alexander Patricia J
Bought by
Smith Lyle E and Smith Doris J
Purchase Details
Closed on
Sep 21, 2011
Sold by
Nichols Norma J and Nichols Merle
Bought by
Alexander Fredric L and Alexander Patricia J
Create a Home Valuation Report for This Property
The Home Valuation Report is an in-depth analysis detailing your home's value as well as a comparison with similar homes in the area
Home Values in the Area
Average Home Value in this Area
Purchase History
| Date | Buyer | Sale Price | Title Company |
|---|---|---|---|
| Speerly Cathy L | -- | None Listed On Document | |
| Speerly Cathy L | $237,500 | None Available | |
| Smith Lyle E | $218,000 | None Available | |
| Alexander Fredric L | $190,000 | First Community Title Svcs |
Source: Public Records
Mortgage History
| Date | Status | Borrower | Loan Amount |
|---|---|---|---|
| Open | Speerly Cathy L | $30,000 |
Source: Public Records
Tax History Compared to Growth
Tax History
| Year | Tax Paid | Tax Assessment Tax Assessment Total Assessment is a certain percentage of the fair market value that is determined by local assessors to be the total taxable value of land and additions on the property. | Land | Improvement |
|---|---|---|---|---|
| 2024 | $5,655 | $94,840 | $16,740 | $78,100 |
| 2023 | $5,655 | $87,070 | $15,370 | $71,700 |
| 2022 | $5,533 | $80,540 | $14,220 | $66,320 |
| 2021 | $6,092 | $77,440 | $13,670 | $63,770 |
| 2020 | $4,867 | $68,350 | $13,670 | $54,680 |
| 2019 | $5,141 | $68,350 | $13,670 | $54,680 |
| 2018 | $4,618 | $68,350 | $13,670 | $54,680 |
| 2017 | $4,562 | $69,060 | $17,210 | $51,850 |
| 2016 | $4,474 | $66,900 | $16,670 | $50,230 |
| 2015 | $4,252 | $0 | $0 | $0 |
| 2013 | $4,171 | $66,900 | $16,670 | $50,230 |
Source: Public Records
Map
Nearby Homes
- 22 Cypress Point
- LOT 42 Eagle Bend
- 17 Osprey Ct
- 7 Country Club Ct
- Lot 7 Grandview Ct
- Lot 2 Grandview Ct
- Lot 1 Grandview Ct
- Lot 35 Grandview Ct
- Lot 37 Grandview Ct
- Lot 33 Grandview Ct
- Lot 13 Grandview Ct
- Lot 3 Grandview Ct
- Lot 20 Grandview Ct
- Lot 6 Grandview Ct
- 1616 Grandlake Ct
- 3747 Grandview Ct
- LOT 96 Aspen Ct
- LOT 95 Aspen Ct
- LOT 92 Aspen Ct
- LOT 91 Aspen Ct
- 14 Cypress Point
- 14 Cypress Point Cul-De-sac
- 13 Cypress Point
- 15 Cypress Point
- 12 Cypress Point
- 16 Cypress Point
- 11 Cypress Point
- 10 Cypress Point
- 9 Cypress Point
- 17 Cypress Point
- 8 Cypress Point
- 18 Cypress Point
- 7 Cypress Point
- 19 Cypress Point
- 6 Cypress Point
- 20 Cypress Point
- 5 Cypress Point
- 21 Cypress Point
- 4 Cypress Point
- 12 Marion Point