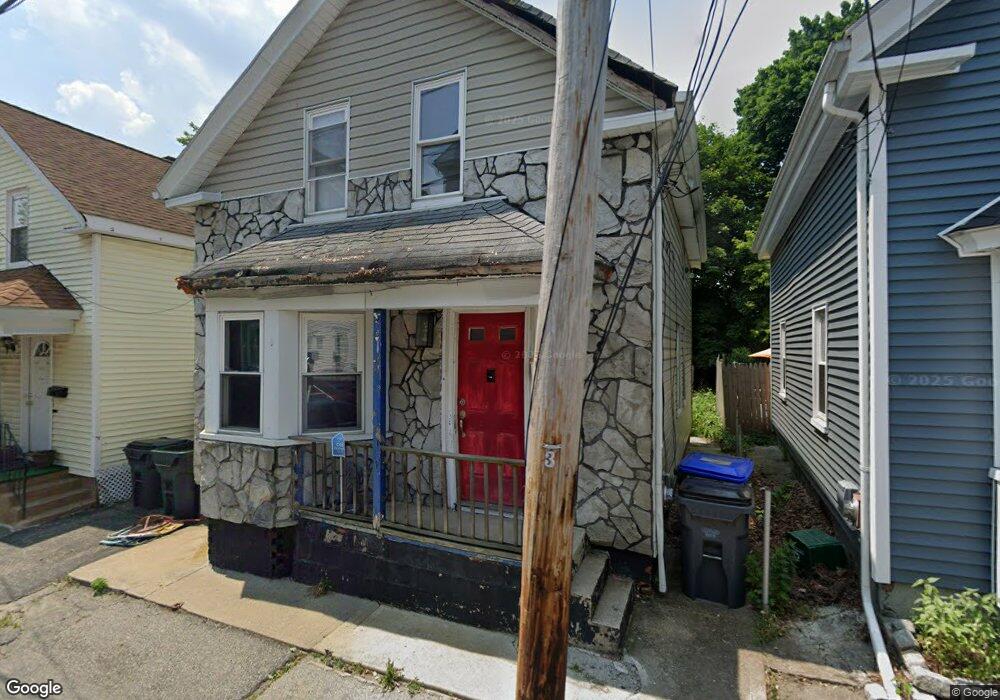
14 Duke St Providence, RI 02908
Smith Hill NeighborhoodEstimated Value: $303,000 - $312,000
3
Beds
2
Baths
828
Sq Ft
$373/Sq Ft
Est. Value
About This Home
This home is located at 14 Duke St, Providence, RI 02908 and is currently estimated at $308,469, approximately $372 per square foot. 14 Duke St is a home located in Providence County with nearby schools including Asa Messer Elementary School, Charles N. Fortes Elementary School, and Veazie Street Elementary School.
Ownership History
Date
Name
Owned For
Owner Type
Purchase Details
Closed on
Aug 1, 2006
Sold by
Bian Solomon T and Alston Victoria N
Bought by
Nkosi Simba
Current Estimated Value
Home Financials for this Owner
Home Financials are based on the most recent Mortgage that was taken out on this home.
Original Mortgage
$154,226
Outstanding Balance
$91,661
Interest Rate
6.67%
Mortgage Type
Purchase Money Mortgage
Estimated Equity
$216,808
Create a Home Valuation Report for This Property
The Home Valuation Report is an in-depth analysis detailing your home's value as well as a comparison with similar homes in the area
Home Values in the Area
Average Home Value in this Area
Purchase History
| Date | Buyer | Sale Price | Title Company |
|---|---|---|---|
| Nkosi Simba | $157,000 | -- |
Source: Public Records
Mortgage History
| Date | Status | Borrower | Loan Amount |
|---|---|---|---|
| Open | Nkosi Simba | $154,226 | |
| Previous Owner | Nkosi Simba | $31,000 |
Source: Public Records
Tax History Compared to Growth
Tax History
| Year | Tax Paid | Tax Assessment Tax Assessment Total Assessment is a certain percentage of the fair market value that is determined by local assessors to be the total taxable value of land and additions on the property. | Land | Improvement |
|---|---|---|---|---|
| 2025 | $2,216 | $263,800 | $140,500 | $123,300 |
| 2024 | $3,173 | $172,900 | $66,300 | $106,600 |
| 2023 | $3,173 | $172,900 | $66,300 | $106,600 |
| 2022 | $3,078 | $172,900 | $66,300 | $106,600 |
| 2021 | $2,702 | $110,000 | $32,700 | $77,300 |
| 2020 | $2,702 | $110,000 | $32,700 | $77,300 |
| 2019 | $2,702 | $110,000 | $32,700 | $77,300 |
| 2018 | $2,477 | $77,500 | $35,100 | $42,400 |
| 2017 | $2,477 | $77,500 | $35,100 | $42,400 |
| 2016 | $2,477 | $77,500 | $35,100 | $42,400 |
| 2015 | $2,830 | $85,500 | $45,900 | $39,600 |
| 2014 | $2,886 | $85,500 | $45,900 | $39,600 |
| 2013 | $2,886 | $85,500 | $45,900 | $39,600 |
Source: Public Records
Map
Nearby Homes