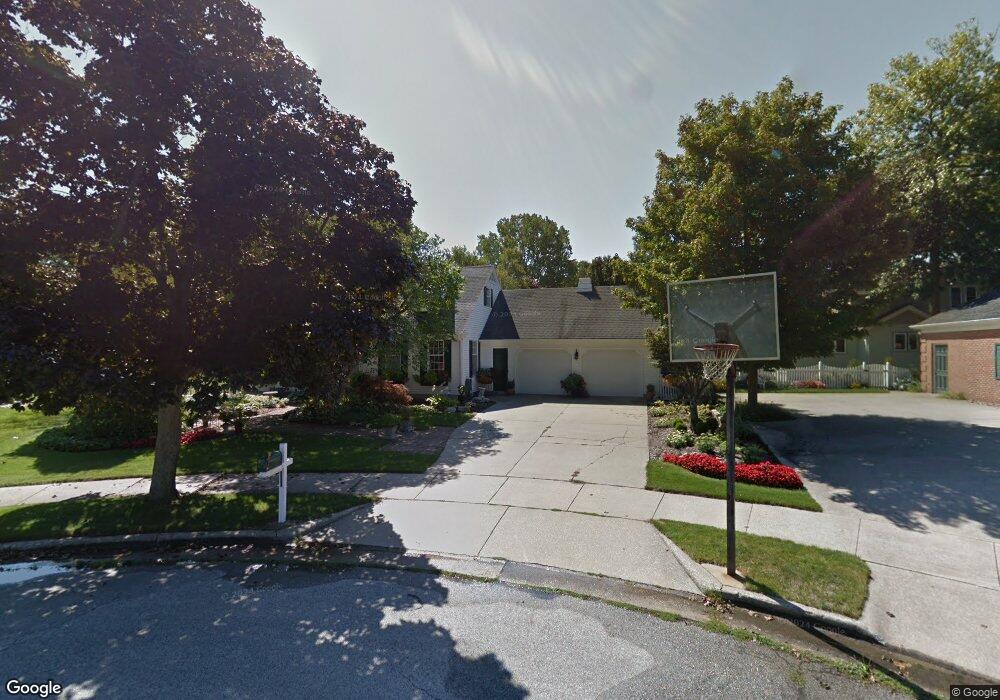
14 E 39th St Holland, MI 49423
Maplewood NeighborhoodEstimated Value: $428,000 - $501,000
4
Beds
3
Baths
2,613
Sq Ft
$177/Sq Ft
Est. Value
About This Home
This home is located at 14 E 39th St, Holland, MI 49423 and is currently estimated at $463,202, approximately $177 per square foot. 14 E 39th St is a home located in Allegan County with nearby schools including Maplewood, Holland High School, and Holland Middle School.
Ownership History
Date
Name
Owned For
Owner Type
Purchase Details
Closed on
Aug 2, 2022
Sold by
Gebben Thomas and Gebben Kerri
Bought by
Gebben Thomas and Gebben Kerri
Current Estimated Value
Purchase Details
Closed on
Jul 7, 2005
Sold by
Zwier Daniel G and Zwier Sally M
Bought by
Gebben Thomas and Gebben Kerri
Home Financials for this Owner
Home Financials are based on the most recent Mortgage that was taken out on this home.
Original Mortgage
$100,000
Interest Rate
5.74%
Mortgage Type
Fannie Mae Freddie Mac
Purchase Details
Closed on
Jan 7, 1988
Sold by
Zwier Daniel G
Create a Home Valuation Report for This Property
The Home Valuation Report is an in-depth analysis detailing your home's value as well as a comparison with similar homes in the area
Home Values in the Area
Average Home Value in this Area
Purchase History
We collect this data history from publicly available records. To have your information removed, we recommend requesting removal directly through your county’s website.
| Date | Buyer | Sale Price | Title Company |
|---|---|---|---|
| Gebben Thomas | -- | None Listed On Document | |
| Gebben Thomas | $255,000 | Metropolitan Title Company | |
| -- | -- | -- | |
| -- | -- | -- |
Source: Public Records
Mortgage History
We collect this data history from publicly available records. To have your information removed, we recommend requesting removal directly through your county’s website.
| Date | Status | Borrower | Loan Amount |
|---|---|---|---|
| Previous Owner | Gebben Thomas | $100,000 |
Source: Public Records
Tax History
| Year | Tax Paid | Tax Assessment Tax Assessment Total Assessment is a certain percentage of the fair market value that is determined by local assessors to be the total taxable value of land and additions on the property. | Land | Improvement |
|---|---|---|---|---|
| 2025 | $4,299 | $221,000 | $37,500 | $183,500 |
| 2024 | -- | $201,400 | $33,100 | $168,300 |
| 2023 | $7,864 | $186,600 | $33,100 | $153,500 |
| 2022 | $3,816 | $164,900 | $26,400 | $138,500 |
| 2021 | $3,654 | $143,800 | $26,400 | $117,400 |
| 2020 | $3,638 | $140,700 | $22,000 | $118,700 |
| 2019 | $3,647 | $126,900 | $17,600 | $109,300 |
| 2018 | $3,463 | $120,200 | $17,600 | $102,600 |
| 2017 | $0 | $93,500 | $9,900 | $83,600 |
| 2016 | $0 | $93,500 | $9,900 | $83,600 |
| 2015 | -- | $93,500 | $9,900 | $83,600 |
| 2014 | -- | $80,500 | $9,900 | $70,600 |
| 2013 | -- | $75,900 | $9,900 | $66,000 |
Source: Public Records
Map
Nearby Homes
- 1012 Maplewood Ct
- 1003 Maplewood Ct
- 59 E 35th St
- 120 E 40th St
- 75 Old Mill Dr Unit 17
- 168 E 37th St
- 996 Colonial Ct
- 754 Central Ave
- 1139 Lincoln Ave Unit 36
- 317 Vista Green Dr
- 301 Vista Green Dr
- 886 Harvest Dr
- 44 W 26th St
- 293 Chatham Ave Unit 15
- 141 E 26th St
- 641 Appletree Dr Unit 13
- 1103 Fountain View Cir Unit 2
- 1117 Fountain View Cir
- 774 Holly Creek Dr Unit 1
- 202 E 26th St
Your Personal Tour Guide
Ask me questions while you tour the home.