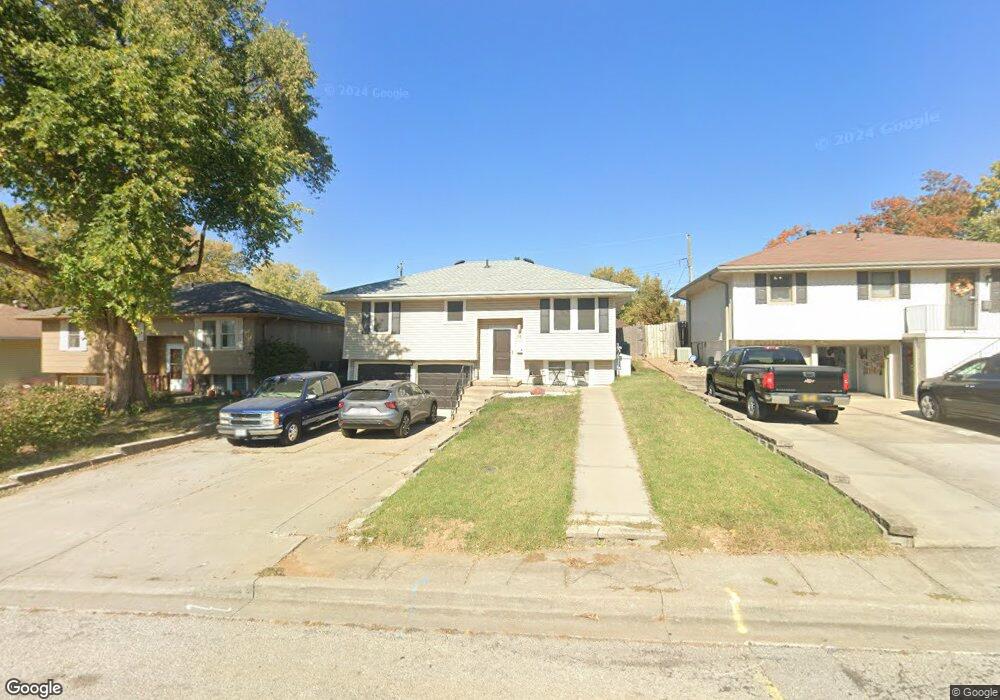
14 E Hurt St Liberty, MO 64068
Estimated Value: $178,000 - $243,000
3
Beds
2
Baths
996
Sq Ft
$226/Sq Ft
Est. Value
About This Home
This home is located at 14 E Hurt St, Liberty, MO 64068 and is currently estimated at $225,051, approximately $225 per square foot. 14 E Hurt St is a home located in Clay County with nearby schools including Ridgeview Elementary School, Heritage Middle School, and Liberty North High School.
Ownership History
Date
Name
Owned For
Owner Type
Purchase Details
Closed on
Jun 11, 2016
Sold by
Petree James Elliot
Bought by
Petree Charlen Lynn
Current Estimated Value
Purchase Details
Closed on
Jun 18, 2003
Sold by
Petree Charleen L and Petree James E
Bought by
Petree Charleen L and Petree James E
Home Financials for this Owner
Home Financials are based on the most recent Mortgage that was taken out on this home.
Original Mortgage
$75,000
Interest Rate
5.44%
Mortgage Type
Purchase Money Mortgage
Purchase Details
Closed on
Aug 14, 1998
Sold by
Graskemper Raymond J and Graskemper Christina M
Bought by
Keller Charleen L
Home Financials for this Owner
Home Financials are based on the most recent Mortgage that was taken out on this home.
Original Mortgage
$64,000
Interest Rate
6.95%
Create a Home Valuation Report for This Property
The Home Valuation Report is an in-depth analysis detailing your home's value as well as a comparison with similar homes in the area
Home Values in the Area
Average Home Value in this Area
Purchase History
| Date | Buyer | Sale Price | Title Company |
|---|---|---|---|
| Petree Charlen Lynn | -- | None Available | |
| Petree Charleen L | -- | -- | |
| Keller Charleen L | -- | United Title Company |
Source: Public Records
Mortgage History
| Date | Status | Borrower | Loan Amount |
|---|---|---|---|
| Closed | Petree Charleen L | $75,000 | |
| Closed | Keller Charleen L | $64,000 |
Source: Public Records
Tax History
| Year | Tax Paid | Tax Assessment Tax Assessment Total Assessment is a certain percentage of the fair market value that is determined by local assessors to be the total taxable value of land and additions on the property. | Land | Improvement |
|---|---|---|---|---|
| 2025 | $1,963 | $28,670 | -- | -- |
| 2024 | $1,963 | $25,520 | -- | -- |
| 2023 | $1,996 | $25,520 | $0 | $0 |
| 2022 | $1,821 | $22,990 | $0 | $0 |
| 2021 | $1,807 | $22,990 | $4,750 | $18,240 |
| 2020 | $1,759 | $21,010 | $0 | $0 |
| 2019 | $1,758 | $21,014 | $4,750 | $16,264 |
Source: Public Records
Map
Nearby Homes
- 5 E Brown St
- 813 S Main St
- 339 S Missouri St
- 408 W Murray Rd
- 1108 S Prairie St
- 336 Georgia Ct
- 463 E Mill St
- 114 S Jewell St
- 324 Harrison St
- 471 E Kansas St
- 537 E Mill St
- 416 E Franklin St
- 1705 Johnston St
- 823 Reed St
- 441 Spring Ave
- 245 N Main St
- 435 Grover St
- 307 N Gallatin St
- 409 Lilly Ln
- 804 Sunset Ave
Your Personal Tour Guide
Ask me questions while you tour the home.