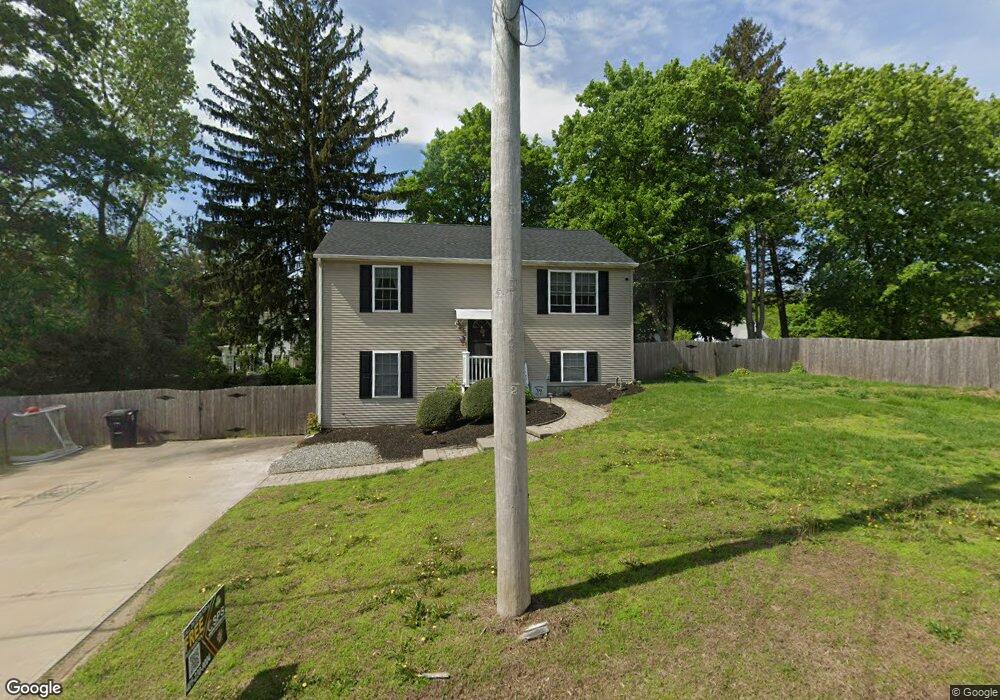
14 Elm St Coventry, RI 02816
Lippitt-Harris NeighborhoodEstimated Value: $372,000 - $427,000
2
Beds
1
Bath
884
Sq Ft
$461/Sq Ft
Est. Value
About This Home
This home is located at 14 Elm St, Coventry, RI 02816 and is currently estimated at $407,786, approximately $461 per square foot. 14 Elm St is a home located in Kent County with nearby schools including Alan Shawn Feinstein Ms Of Cov, Coventry High School, and St Joseph School.
Ownership History
Date
Name
Owned For
Owner Type
Purchase Details
Closed on
Aug 15, 2018
Sold by
Werta Terrie A
Bought by
Laurie Jacob M
Current Estimated Value
Purchase Details
Closed on
Jan 24, 2002
Sold by
Arcand Walter W
Bought by
Peixinho Jonathan D and Babikia Sonia M
Create a Home Valuation Report for This Property
The Home Valuation Report is an in-depth analysis detailing your home's value as well as a comparison with similar homes in the area
Home Values in the Area
Average Home Value in this Area
Purchase History
| Date | Buyer | Sale Price | Title Company |
|---|---|---|---|
| Laurie Jacob M | $199,900 | -- | |
| Peixinho Jonathan D | $133,000 | -- |
Source: Public Records
Mortgage History
| Date | Status | Borrower | Loan Amount |
|---|---|---|---|
| Previous Owner | Peixinho Jonathan D | $21,000 | |
| Previous Owner | Peixinho Jonathan D | $198,000 | |
| Previous Owner | Peixinho Jonathan D | $42,500 |
Source: Public Records
Tax History
| Year | Tax Paid | Tax Assessment Tax Assessment Total Assessment is a certain percentage of the fair market value that is determined by local assessors to be the total taxable value of land and additions on the property. | Land | Improvement |
|---|---|---|---|---|
| 2025 | $4,924 | $306,000 | $131,100 | $174,900 |
| 2024 | $4,910 | $310,000 | $131,100 | $178,900 |
| 2023 | $4,752 | $310,000 | $131,100 | $178,900 |
| 2022 | $4,720 | $241,200 | $115,000 | $126,200 |
| 2021 | $4,679 | $241,200 | $115,000 | $126,200 |
| 2020 | $5,364 | $241,200 | $115,000 | $126,200 |
| 2019 | $5,015 | $225,500 | $104,200 | $121,300 |
| 2018 | $4,873 | $225,500 | $104,200 | $121,300 |
| 2017 | $4,731 | $225,500 | $104,200 | $121,300 |
| 2016 | $3,907 | $182,500 | $76,800 | $105,700 |
| 2015 | $3,743 | $179,700 | $76,800 | $102,900 |
| 2014 | $3,665 | $182,600 | $76,800 | $105,800 |
| 2013 | $3,611 | $193,500 | $82,300 | $111,200 |
Source: Public Records
Map
Nearby Homes
Your Personal Tour Guide
Ask me questions while you tour the home.