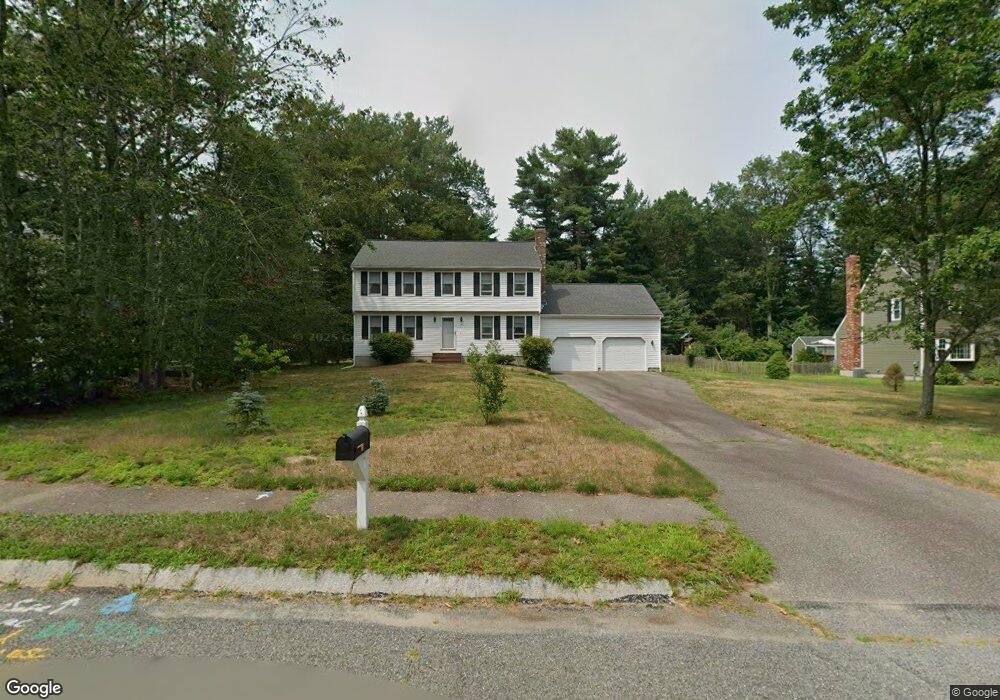
14 Elmwood Ct Mansfield, MA 02048
Estimated Value: $633,000 - $750,193
4
Beds
2
Baths
1,821
Sq Ft
$382/Sq Ft
Est. Value
About This Home
This home is located at 14 Elmwood Ct, Mansfield, MA 02048 and is currently estimated at $695,798, approximately $382 per square foot. 14 Elmwood Ct is a home located in Bristol County with nearby schools including Everett W. Robinson Elementary School, Jordan/Jackson Elementary School, and Harold L. Qualters Middle School.
Ownership History
Date
Name
Owned For
Owner Type
Purchase Details
Closed on
Nov 10, 1992
Sold by
Folkman & Zola Bldrs
Bought by
Giffels Kenneth M and Giffels Joan F
Current Estimated Value
Home Financials for this Owner
Home Financials are based on the most recent Mortgage that was taken out on this home.
Original Mortgage
$123,000
Interest Rate
7.99%
Mortgage Type
Purchase Money Mortgage
Create a Home Valuation Report for This Property
The Home Valuation Report is an in-depth analysis detailing your home's value as well as a comparison with similar homes in the area
Home Values in the Area
Average Home Value in this Area
Purchase History
| Date | Buyer | Sale Price | Title Company |
|---|---|---|---|
| Giffels Kenneth M | $170,000 | -- |
Source: Public Records
Mortgage History
| Date | Status | Borrower | Loan Amount |
|---|---|---|---|
| Open | Giffels Kenneth M | $118,000 | |
| Closed | Giffels Kenneth M | $12,000 | |
| Closed | Giffels Kenneth M | $123,000 |
Source: Public Records
Tax History Compared to Growth
Tax History
| Year | Tax Paid | Tax Assessment Tax Assessment Total Assessment is a certain percentage of the fair market value that is determined by local assessors to be the total taxable value of land and additions on the property. | Land | Improvement |
|---|---|---|---|---|
| 2025 | $8,011 | $608,300 | $272,000 | $336,300 |
| 2024 | $7,983 | $591,300 | $283,900 | $307,400 |
| 2023 | $7,778 | $552,000 | $283,900 | $268,100 |
| 2022 | $7,494 | $494,000 | $262,700 | $231,300 |
| 2021 | $7,172 | $466,900 | $219,000 | $247,900 |
| 2020 | $7,070 | $460,300 | $219,000 | $241,300 |
| 2019 | $3,052 | $428,600 | $182,400 | $246,200 |
| 2018 | $6,471 | $415,600 | $173,900 | $241,700 |
| 2017 | $2,794 | $403,900 | $168,900 | $235,000 |
| 2016 | $5,712 | $370,700 | $160,800 | $209,900 |
| 2015 | $5,578 | $359,900 | $160,800 | $199,100 |
Source: Public Records
Map
Nearby Homes
- 176 Elm St
- 2 Oak St Unit 2D
- 2 Oak St Unit 2A
- 2 Oak St Unit 2C
- 2 Oak St Unit 2B
- 37 Oakleaf Dr
- 451R Gilbert St
- 4 Buckskin Dr
- 150 Gilbert St
- 250 Mansfield Ave Unit 66
- 14 Country Club Way
- 255 Mckeon Dr
- 15 Reservoir St Unit 44
- 157 Mansfield Ave Unit 14
- 4 Village Way Unit F
- 18 Columbine Rd
- 231 Spring St
- 24 Maverick Dr
- 19 Precourt Ln
- 21 Juniper Rd