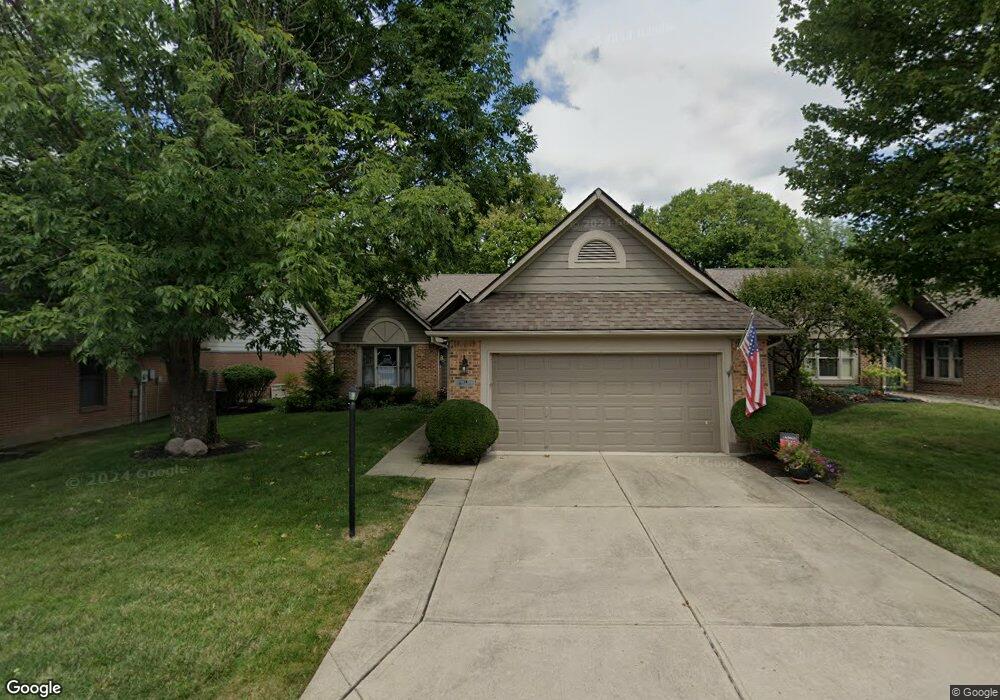
14 Hathaway Commons Lebanon, OH 45036
Estimated Value: $377,000 - $397,000
2
Beds
2
Baths
1,891
Sq Ft
$204/Sq Ft
Est. Value
About This Home
This home is located at 14 Hathaway Commons, Lebanon, OH 45036 and is currently estimated at $385,393, approximately $203 per square foot. 14 Hathaway Commons is a home located in Warren County with nearby schools including Bowman Primary School, Berry Intermediate School, and Donovan Elementary School.
Ownership History
Date
Name
Owned For
Owner Type
Purchase Details
Closed on
Apr 1, 2025
Sold by
Mcdonel Carol S
Bought by
Burris John Scott and Burris Jacqueline
Current Estimated Value
Purchase Details
Closed on
Aug 6, 2018
Sold by
Conn Family Trust
Bought by
Mcdonel James D and Mcdonel Carol S
Purchase Details
Closed on
Feb 7, 2018
Sold by
Conn Irma H
Bought by
Conn Family Trust
Purchase Details
Closed on
Feb 14, 2017
Sold by
Conn Irma H
Bought by
Conn Family Irrevocable
Purchase Details
Closed on
Oct 1, 2010
Sold by
Conn W Dennis and Conn Irma H
Bought by
Conn Irma H
Purchase Details
Closed on
Jun 12, 1996
Sold by
Oberer Dev Inc
Bought by
Dennis Dennis W and Dennis Conn H
Home Financials for this Owner
Home Financials are based on the most recent Mortgage that was taken out on this home.
Original Mortgage
$105,000
Interest Rate
8.05%
Mortgage Type
New Conventional
Create a Home Valuation Report for This Property
The Home Valuation Report is an in-depth analysis detailing your home's value as well as a comparison with similar homes in the area
Home Values in the Area
Average Home Value in this Area
Purchase History
| Date | Buyer | Sale Price | Title Company |
|---|---|---|---|
| Burris John Scott | $375,000 | None Listed On Document | |
| Mcdonel James D | $250,000 | None Available | |
| Conn Family Trust | -- | -- | |
| Conn Family Irrevocable | -- | -- | |
| Conn Irma H | -- | Attorney | |
| Dennis Dennis W | $176,310 | -- |
Source: Public Records
Mortgage History
| Date | Status | Borrower | Loan Amount |
|---|---|---|---|
| Previous Owner | Dennis Dennis W | $105,000 |
Source: Public Records
Tax History Compared to Growth
Tax History
| Year | Tax Paid | Tax Assessment Tax Assessment Total Assessment is a certain percentage of the fair market value that is determined by local assessors to be the total taxable value of land and additions on the property. | Land | Improvement |
|---|---|---|---|---|
| 2024 | $4,634 | $111,600 | $26,250 | $85,350 |
| 2023 | $3,950 | $85,480 | $15,820 | $69,660 |
| 2022 | $4,118 | $85,481 | $15,820 | $69,661 |
| 2021 | $3,892 | $85,481 | $15,820 | $69,661 |
| 2020 | $4,078 | $75,646 | $14,000 | $61,646 |
| 2019 | $4,180 | $75,646 | $14,000 | $61,646 |
| 2018 | $3,105 | $75,646 | $14,000 | $61,646 |
| 2017 | $2,840 | $63,641 | $11,970 | $51,671 |
| 2016 | $2,929 | $63,641 | $11,970 | $51,671 |
| 2015 | $2,951 | $63,641 | $11,970 | $51,671 |
| 2014 | $3,073 | $63,640 | $11,970 | $51,670 |
| 2013 | $2,956 | $74,430 | $14,000 | $60,430 |
Source: Public Records
Map
Nearby Homes
- 16 Hathaway Commons
- 10 Hathaway Commons
- 18 Hathaway Commons
- 13 Hathaway Commons
- 15 Hathaway Commons
- 8 Hathaway Commons
- 17 Hathaway Commons
- 20 Hathaway Commons
- 11 Hathaway Commons
- 9 Hathaway Commons
- 6 Hathaway Commons
- 22 Hathaway Commons
- 5 Hathaway Commons
- 5 Hathaway Common
- 39 Hathaway Commons
- 527 French Run Ct
- 1020 Country Creek Dr
- 4 Hathaway Commons
- 4 Hathaway Commons
- 523 French Run Ct