Estimated Value: $1,050,302 - $1,223,000
2
Beds
1
Bath
870
Sq Ft
$1,279/Sq Ft
Est. Value
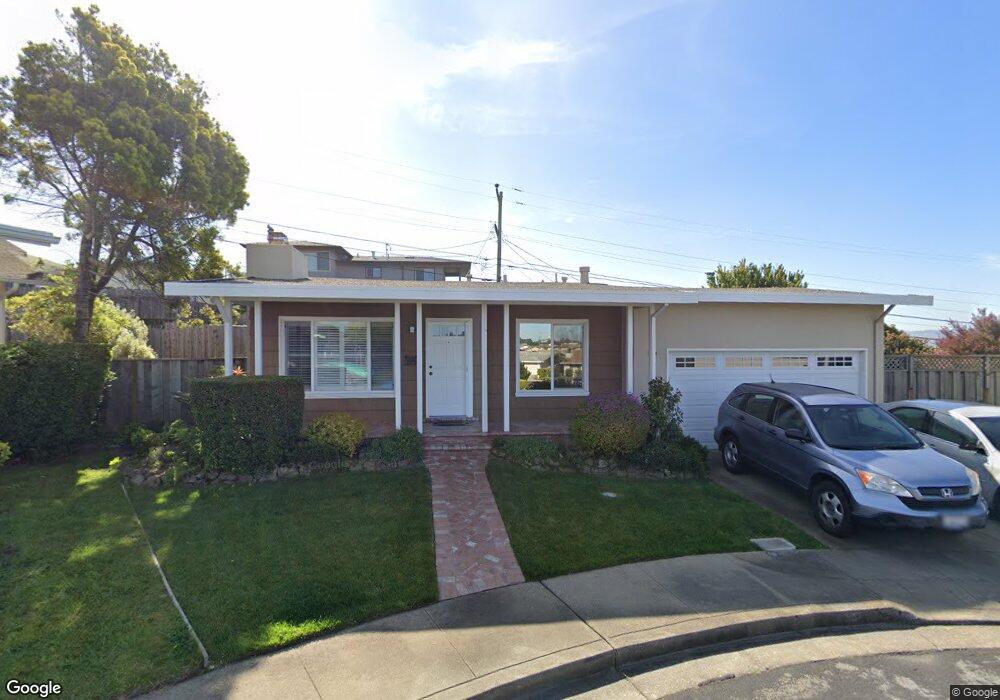
About This Home
This home is located at 14 Iris Ct, South San Francisco, CA 94080 and is currently estimated at $1,113,076, approximately $1,279 per square foot. 14 Iris Ct is a home located in San Mateo County with nearby schools including Sunshine Gardens Elementary School, Parkway Heights Middle School, and El Camino High School.
Ownership History
Date
Name
Owned For
Owner Type
Purchase Details
Closed on
Oct 14, 2006
Sold by
Lebovitz Jerry J
Bought by
Lebovitz Jerry J and The 1988 Lebovitz Trust
Current Estimated Value
Purchase Details
Closed on
Feb 28, 2006
Sold by
Lebovitz Deborah and Lebovitz Jerry
Bought by
Lebovitz Deborah
Purchase Details
Closed on
Aug 19, 2002
Sold by
Lebovitz Jerry and Lebovitz Linda
Bought by
Lebovitz Jerry and Lebovits Linda
Purchase Details
Closed on
Oct 29, 1999
Sold by
Lebovitz Jerry and Lebovitz Linda
Bought by
Lebovitz Jerry J and Lebovitz Linda R
Home Financials for this Owner
Home Financials are based on the most recent Mortgage that was taken out on this home.
Original Mortgage
$233,200
Interest Rate
7.37%
Purchase Details
Closed on
Sep 22, 1999
Sold by
Spognardi Angela M
Bought by
Lebovitz Jerry and Lebovitz Linda
Home Financials for this Owner
Home Financials are based on the most recent Mortgage that was taken out on this home.
Original Mortgage
$233,200
Interest Rate
7.37%
Create a Home Valuation Report for This Property
The Home Valuation Report is an in-depth analysis detailing your home's value as well as a comparison with similar homes in the area
Home Values in the Area
Average Home Value in this Area
Purchase History
| Date | Buyer | Sale Price | Title Company |
|---|---|---|---|
| Lebovitz Jerry J | -- | None Available | |
| Lebovitz Deborah | -- | None Available | |
| Lebovitz Jerry | -- | -- | |
| Lebovitz Jerry J | $27,000 | -- | |
| Lebovitz Jerry | $291,500 | Fidelity National Title Co |
Source: Public Records
Mortgage History
| Date | Status | Borrower | Loan Amount |
|---|---|---|---|
| Previous Owner | Lebovitz Jerry | $233,200 |
Source: Public Records
Tax History Compared to Growth
Tax History
| Year | Tax Paid | Tax Assessment Tax Assessment Total Assessment is a certain percentage of the fair market value that is determined by local assessors to be the total taxable value of land and additions on the property. | Land | Improvement |
|---|---|---|---|---|
| 2025 | $5,569 | $448,004 | $224,002 | $224,002 |
| 2023 | $5,569 | $430,608 | $215,304 | $215,304 |
| 2022 | $5,176 | $422,166 | $211,083 | $211,083 |
| 2021 | $5,105 | $413,890 | $206,945 | $206,945 |
| 2020 | $5,040 | $409,648 | $204,824 | $204,824 |
| 2019 | $4,988 | $401,616 | $200,808 | $200,808 |
| 2018 | $4,870 | $393,742 | $196,871 | $196,871 |
| 2017 | $4,729 | $386,022 | $193,011 | $193,011 |
| 2016 | $4,601 | $378,454 | $189,227 | $189,227 |
| 2015 | $4,600 | $372,770 | $186,385 | $186,385 |
| 2014 | $4,423 | $365,468 | $182,734 | $182,734 |
Source: Public Records
Map
Nearby Homes
- 829 Stonegate Dr
- 304 Evergreen Dr
- 252 Sequoia Ave
- 121 Northcrest Dr
- 25 Windcrest Ln
- 728 Cottonwood Ave
- 889 Mclellan Dr Unit 302
- 889 Mclellan Dr Unit 205
- 729 Grand Ave
- 738 Baden Ave
- 16 Cymbidium Cir
- 645 Baden Ave Unit 4
- 311 Magnolia Ave
- 577 Miller Ave
- 8 Parkgrove Dr
- 653 Commercial Ave
- 1700 El Camino Real Unit 2-03
- 1700 El Camino Real
- 632 1st Ln
- 0 Indio Dr
- 1119 Morningside Ave
- 1123 Morningside Ave
- 15 Iris Ct
- 10 Iris Ct
- 1115 Morningside Ave
- 1127 Morningside Ave
- 6 Iris Ct
- 1111 Morningside Ave
- 11 Iris Ct
- 1149 Morningside Ave
- 1145 Morningside Ave
- 1153 Morningside Ave
- 436 Forest View Dr
- 2 Iris Ct
- 7 Iris Ct
- 1141 Morningside Ave
- 1157 Morningside Ave
- 430 Forest View Dr
- 3 Iris Ct
- 1161 Morningside Ave