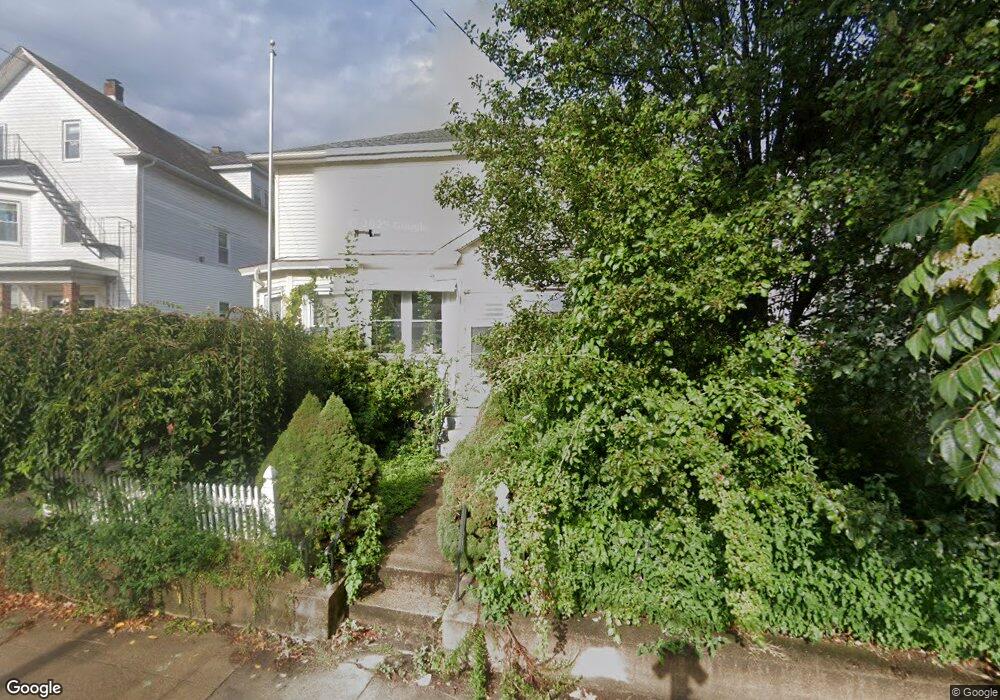
14 Mcniff St West Warwick, RI 02893
West Warwick Centre NeighborhoodEstimated Value: $342,000 - $422,000
3
Beds
1
Bath
1,504
Sq Ft
$249/Sq Ft
Est. Value
About This Home
This home is located at 14 Mcniff St, West Warwick, RI 02893 and is currently estimated at $375,085, approximately $249 per square foot. 14 Mcniff St is a home located in Kent County with nearby schools including West Warwick High School.
Ownership History
Date
Name
Owned For
Owner Type
Purchase Details
Closed on
May 14, 2021
Sold by
West Warwick Town Of
Bought by
Blackrock Investments Llc
Current Estimated Value
Purchase Details
Closed on
May 24, 2019
Sold by
West Warwick Town Of
Bought by
Reservoir Adventures Llc
Purchase Details
Closed on
Dec 16, 2014
Sold by
Nichols Robin A and Nichols Robin A
Bought by
Gosselin Christopher and Gosselin Gladys N
Purchase Details
Closed on
Oct 29, 2008
Sold by
Gosselin Christopher and Gosselin Gladys N
Bought by
Nichols Edward R and Nichols Robin A
Home Financials for this Owner
Home Financials are based on the most recent Mortgage that was taken out on this home.
Original Mortgage
$185,000
Interest Rate
5.83%
Mortgage Type
Purchase Money Mortgage
Create a Home Valuation Report for This Property
The Home Valuation Report is an in-depth analysis detailing your home's value as well as a comparison with similar homes in the area
Home Values in the Area
Average Home Value in this Area
Purchase History
| Date | Buyer | Sale Price | Title Company |
|---|---|---|---|
| Blackrock Investments Llc | $10,540 | None Available | |
| Blackrock Investments Llc | $10,540 | None Available | |
| Reservoir Adventures Llc | $9,099 | -- | |
| Reservoir Adventures Llc | $9,099 | -- | |
| Gosselin Christopher | $188,766 | -- | |
| Nichols Edward R | $185,000 | -- | |
| Gosselin Christopher | $188,766 | -- | |
| Nichols Edward R | $185,000 | -- |
Source: Public Records
Mortgage History
| Date | Status | Borrower | Loan Amount |
|---|---|---|---|
| Previous Owner | Nichols Edward R | $185,000 |
Source: Public Records
Tax History Compared to Growth
Tax History
| Year | Tax Paid | Tax Assessment Tax Assessment Total Assessment is a certain percentage of the fair market value that is determined by local assessors to be the total taxable value of land and additions on the property. | Land | Improvement |
|---|---|---|---|---|
| 2025 | $4,276 | $299,200 | $76,200 | $223,000 |
| 2024 | $4,616 | $247,000 | $48,400 | $198,600 |
| 2023 | $4,525 | $247,000 | $48,400 | $198,600 |
| 2022 | $4,456 | $247,000 | $48,400 | $198,600 |
| 2021 | $4,016 | $174,600 | $39,700 | $134,900 |
| 2020 | $4,016 | $174,600 | $39,700 | $134,900 |
| 2019 | $5,119 | $174,600 | $39,700 | $134,900 |
| 2018 | $3,452 | $130,700 | $37,400 | $93,300 |
| 2017 | $3,439 | $130,700 | $37,400 | $93,300 |
| 2016 | $3,377 | $130,700 | $37,400 | $93,300 |
| 2015 | $3,375 | $130,000 | $37,300 | $92,700 |
| 2014 | $825 | $130,000 | $37,300 | $92,700 |
Source: Public Records
Map
Nearby Homes