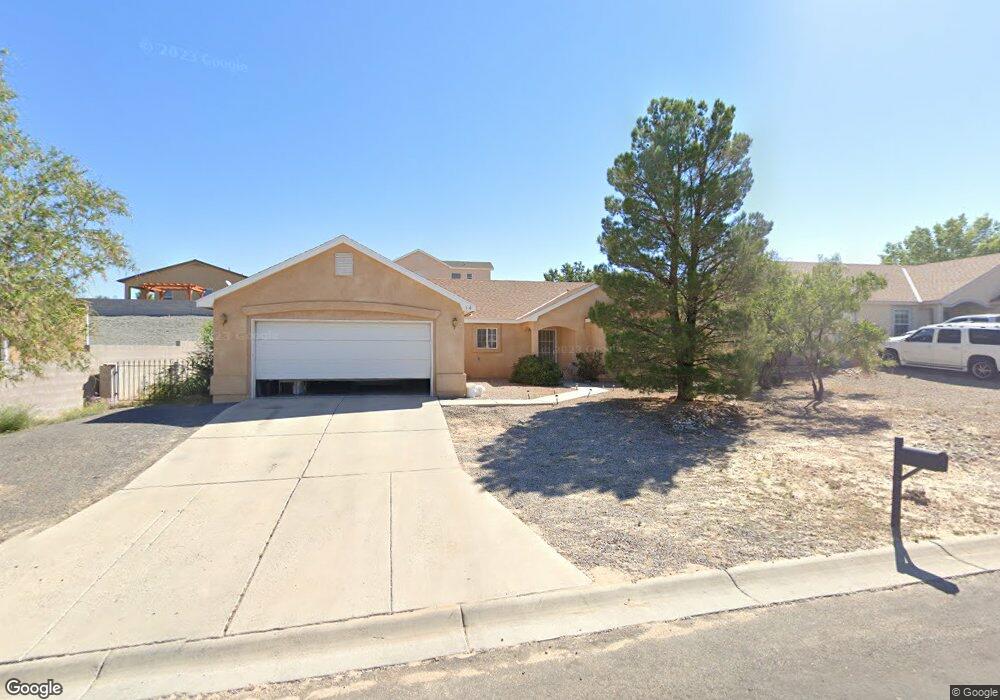
14 Parador Rd Unit 1 Los Lunas, NM 87031
Las Maravillas NeighborhoodEstimated Value: $237,000 - $291,000
3
Beds
2
Baths
1,540
Sq Ft
$179/Sq Ft
Est. Value
About This Home
This home is located at 14 Parador Rd Unit 1, Los Lunas, NM 87031 and is currently estimated at $274,952, approximately $178 per square foot. 14 Parador Rd Unit 1 is a home located in Valencia County with nearby schools including Ann Parish Elementary School, Los Lunas Middle School, and Los Lunas High School.
Ownership History
Date
Name
Owned For
Owner Type
Purchase Details
Closed on
Oct 14, 2021
Sold by
Arneson David
Bought by
Brown Michael A
Current Estimated Value
Home Financials for this Owner
Home Financials are based on the most recent Mortgage that was taken out on this home.
Original Mortgage
$204,133
Outstanding Balance
$184,934
Interest Rate
2.8%
Mortgage Type
FHA
Estimated Equity
$90,018
Purchase Details
Closed on
Jun 7, 2012
Sold by
Arneson David and Arneson Kristina
Bought by
Arneson David
Home Financials for this Owner
Home Financials are based on the most recent Mortgage that was taken out on this home.
Original Mortgage
$118,250
Interest Rate
3.08%
Mortgage Type
New Conventional
Purchase Details
Closed on
Dec 16, 2005
Sold by
Laney Robbye J and Laney Debbie
Bought by
Arneson David
Home Financials for this Owner
Home Financials are based on the most recent Mortgage that was taken out on this home.
Original Mortgage
$125,900
Interest Rate
6.3%
Mortgage Type
New Conventional
Create a Home Valuation Report for This Property
The Home Valuation Report is an in-depth analysis detailing your home's value as well as a comparison with similar homes in the area
Home Values in the Area
Average Home Value in this Area
Purchase History
| Date | Buyer | Sale Price | Title Company |
|---|---|---|---|
| Brown Michael A | -- | Fidelity National Title Ins | |
| Arneson David | -- | None Available | |
| Arneson David | -- | None Available |
Source: Public Records
Mortgage History
| Date | Status | Borrower | Loan Amount |
|---|---|---|---|
| Open | Brown Michael A | $204,133 | |
| Previous Owner | Arneson David | $118,250 | |
| Previous Owner | Arneson David | $125,900 |
Source: Public Records
Tax History Compared to Growth
Tax History
| Year | Tax Paid | Tax Assessment Tax Assessment Total Assessment is a certain percentage of the fair market value that is determined by local assessors to be the total taxable value of land and additions on the property. | Land | Improvement |
|---|---|---|---|---|
| 2025 | $1,727 | $71,379 | $11,962 | $59,417 |
| 2024 | $1,727 | $69,300 | $11,667 | $57,633 |
| 2023 | $1,752 | $69,300 | $11,667 | $57,633 |
| 2022 | $1,741 | $69,300 | $11,667 | $57,633 |
| 2021 | $1,437 | $56,825 | $7,954 | $48,871 |
| 2020 | $1,414 | $55,170 | $7,722 | $47,448 |
| 2019 | $1,409 | $55,170 | $7,722 | $47,448 |
| 2018 | $1,368 | $54,056 | $7,722 | $46,334 |
| 2017 | $1,316 | $52,482 | $7,722 | $44,760 |
| 2016 | $1,263 | $50,953 | $7,722 | $43,231 |
| 2015 | -- | $49,469 | $7,722 | $41,747 |
| 2013 | -- | $47,898 | $7,722 | $40,176 |
| 2011 | -- | $139,509 | $22,491 | $117,018 |
Source: Public Records
Map
Nearby Homes
- 3 Parador Rd
- 8 Camel Rd
- 6 El Tigre Dr
- 11 El Tigre Dr
- 13 Wilson Rd
- 20 Bravo Rd
- 49 Milton Loop
- 18 Hermanos Loop
- 19 Hermanos Loop
- 1 Genie Ct
- 50 Hermanos Loop
- Duranta Plan at Eastland Hills
- Valencia Plan at Eastland Hills
- Clovis Plan at Eastland Hills
- Tularosa Plan at Eastland Hills
- Eagle Nest Plan at Eastland Hills
- Sophora Plan at Eastland Hills
- 7 Avenida Merida
- 11 Alamosa Loop
- 18 Avenida Merida