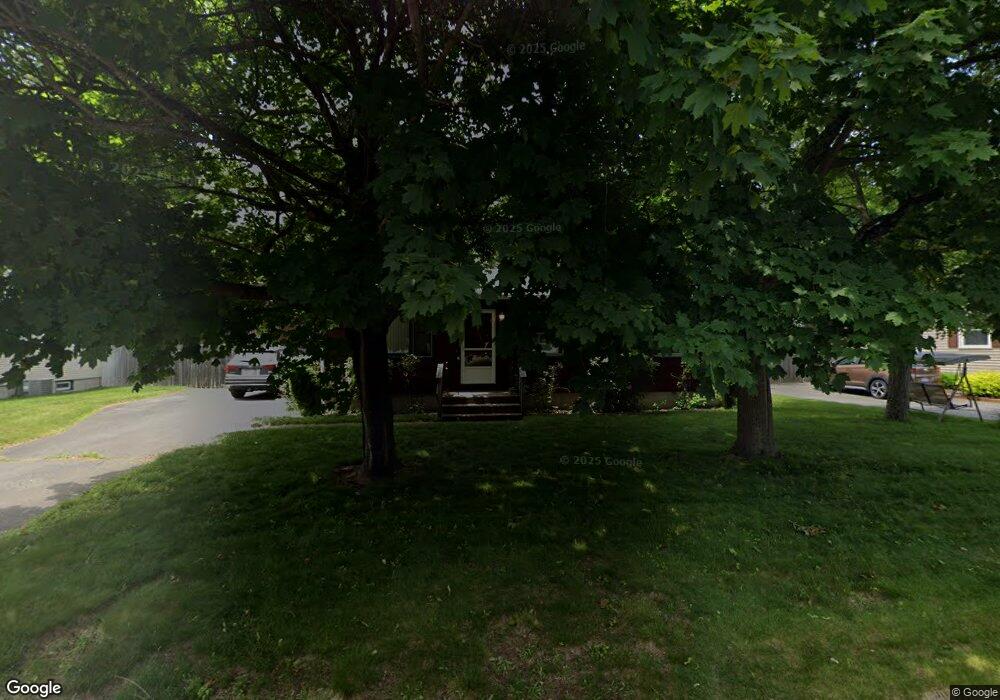
14 Pinecrest Dr Springfield, MA 01118
East Forest Park NeighborhoodEstimated Value: $277,000 - $304,000
3
Beds
1
Bath
1,053
Sq Ft
$277/Sq Ft
Est. Value
About This Home
This home is located at 14 Pinecrest Dr, Springfield, MA 01118 and is currently estimated at $291,737, approximately $277 per square foot. 14 Pinecrest Dr is a home located in Hampden County with nearby schools including Frederick Harris Elementary School, M Marcus Kiley Middle, and Springfield High School of Science and Technology.
Ownership History
Date
Name
Owned For
Owner Type
Purchase Details
Closed on
Nov 28, 2001
Sold by
Reynolds Dorothy M
Bought by
Robitaille Glen P
Current Estimated Value
Home Financials for this Owner
Home Financials are based on the most recent Mortgage that was taken out on this home.
Original Mortgage
$93,532
Outstanding Balance
$36,792
Interest Rate
6.66%
Mortgage Type
Purchase Money Mortgage
Estimated Equity
$254,945
Purchase Details
Closed on
Jun 3, 1996
Sold by
Messier Richard B and Messier Anne E
Bought by
Reynolds Howard S and Reynolds Dorothy M
Purchase Details
Closed on
Jun 20, 1988
Sold by
Berard & Sons Inc
Bought by
Messier Richard B
Home Financials for this Owner
Home Financials are based on the most recent Mortgage that was taken out on this home.
Original Mortgage
$99,000
Interest Rate
10.24%
Mortgage Type
Purchase Money Mortgage
Create a Home Valuation Report for This Property
The Home Valuation Report is an in-depth analysis detailing your home's value as well as a comparison with similar homes in the area
Home Values in the Area
Average Home Value in this Area
Purchase History
| Date | Buyer | Sale Price | Title Company |
|---|---|---|---|
| Robitaille Glen P | $95,000 | -- | |
| Reynolds Howard S | $86,000 | -- | |
| Messier Richard B | $110,000 | -- |
Source: Public Records
Mortgage History
| Date | Status | Borrower | Loan Amount |
|---|---|---|---|
| Open | Messier Richard B | $93,532 | |
| Previous Owner | Messier Richard B | $99,000 |
Source: Public Records
Tax History
| Year | Tax Paid | Tax Assessment Tax Assessment Total Assessment is a certain percentage of the fair market value that is determined by local assessors to be the total taxable value of land and additions on the property. | Land | Improvement |
|---|---|---|---|---|
| 2025 | $3,556 | $226,800 | $51,400 | $175,400 |
| 2024 | $3,607 | $224,600 | $51,400 | $173,200 |
| 2023 | $2,856 | $167,500 | $49,000 | $118,500 |
| 2022 | $3,120 | $165,800 | $49,000 | $116,800 |
| 2021 | $3,171 | $167,800 | $44,500 | $123,300 |
| 2020 | $2,961 | $151,600 | $44,500 | $107,100 |
| 2019 | $2,844 | $144,500 | $44,500 | $100,000 |
| 2018 | $2,724 | $138,400 | $44,500 | $93,900 |
| 2017 | $2,723 | $138,500 | $44,500 | $94,000 |
| 2016 | $2,371 | $120,600 | $44,500 | $76,100 |
| 2015 | $2,297 | $116,800 | $44,500 | $72,300 |
Source: Public Records
Map
Nearby Homes
- 19 Manor Ct Unit 19
- 55 Allen St
- 125 Manor Ct Unit 125
- 101 Regal St
- 49 Corcoran Blvd
- 509 Plumtree Rd
- 47 Hartford Terrace
- 647 Plumtree Rd
- 119 Powell Ave
- 37 Chesterfield Ave
- 17 Pebble Mill Rd
- 79 Roosevelt Ave
- 7 Ashbrook St
- 206 Treetop Ave
- 46 Hadley St
- 75 Gillette Cir
- 1088 Sumner Ave
- 13 Bither St
- 29 Eddywood St
- 86 Talmadge Dr
Your Personal Tour Guide
Ask me questions while you tour the home.