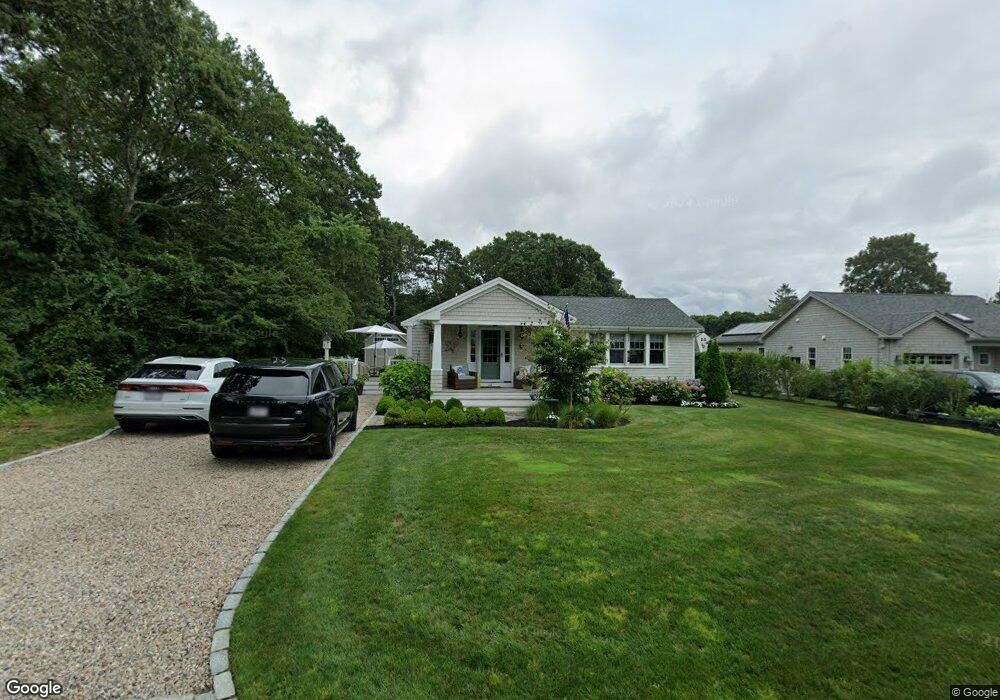
14 Robin Ln Pocasset, MA 02559
Pocasset NeighborhoodEstimated Value: $870,000 - $1,053,000
3
Beds
2
Baths
1,816
Sq Ft
$541/Sq Ft
Est. Value
About This Home
This home is located at 14 Robin Ln, Pocasset, MA 02559 and is currently estimated at $981,566, approximately $540 per square foot. 14 Robin Ln is a home located in Barnstable County with nearby schools including Bourne High School and Cadence Academy Preschool - Bourne.
Ownership History
Date
Name
Owned For
Owner Type
Purchase Details
Closed on
Jul 12, 2012
Sold by
Pocasset Home Rt and Monaghan
Bought by
Boilard Michael R and Boilard Lise M
Current Estimated Value
Home Financials for this Owner
Home Financials are based on the most recent Mortgage that was taken out on this home.
Original Mortgage
$204,000
Outstanding Balance
$140,410
Interest Rate
3.76%
Mortgage Type
New Conventional
Estimated Equity
$841,156
Create a Home Valuation Report for This Property
The Home Valuation Report is an in-depth analysis detailing your home's value as well as a comparison with similar homes in the area
Home Values in the Area
Average Home Value in this Area
Purchase History
| Date | Buyer | Sale Price | Title Company |
|---|---|---|---|
| Boilard Michael R | $255,000 | -- | |
| Boilard Michael R | $255,000 | -- |
Source: Public Records
Mortgage History
| Date | Status | Borrower | Loan Amount |
|---|---|---|---|
| Open | Boilard Michael R | $204,000 | |
| Closed | Boilard Michael R | $204,000 | |
| Previous Owner | Boilard Michael R | $30,000 |
Source: Public Records
Tax History
| Year | Tax Paid | Tax Assessment Tax Assessment Total Assessment is a certain percentage of the fair market value that is determined by local assessors to be the total taxable value of land and additions on the property. | Land | Improvement |
|---|---|---|---|---|
| 2025 | $7,603 | $973,500 | $465,700 | $507,800 |
| 2024 | $7,115 | $887,100 | $443,500 | $443,600 |
| 2023 | $6,505 | $738,400 | $345,400 | $393,000 |
| 2022 | $5,885 | $583,300 | $270,900 | $312,400 |
| 2021 | $5,722 | $531,300 | $246,600 | $284,700 |
| 2020 | $5,549 | $516,700 | $244,200 | $272,500 |
| 2019 | $3,886 | $369,700 | $244,200 | $125,500 |
| 2018 | $3,329 | $315,800 | $238,600 | $77,200 |
| 2017 | $3,464 | $336,300 | $259,900 | $76,400 |
| 2016 | $3,140 | $309,100 | $236,300 | $72,800 |
| 2015 | $3,113 | $309,100 | $236,300 | $72,800 |
Source: Public Records
Map
Nearby Homes
- 14 Navajo Rd
- 14 Virginia Rd
- 6 Andrea Rd
- 254 Barlows Landing Rd
- 16 Michael Rd
- 709 County Rd
- 566 Shore Rd
- 23 Club House Dr
- 3 1st St
- 3 4th Ave
- 7 4th Ave
- 1090 Shore Rd Unit 7
- 135 Leeward Rd
- 10 Howard Ave
- 48 Red Brook Harbor Rd
- 10 Howard Ave
- 1 Hawthorne Ct Unit C
- 1094 County Rd
- 77 Roundhouse Rd Unit 77
- 75 Winsor Rd
Your Personal Tour Guide
Ask me questions while you tour the home.