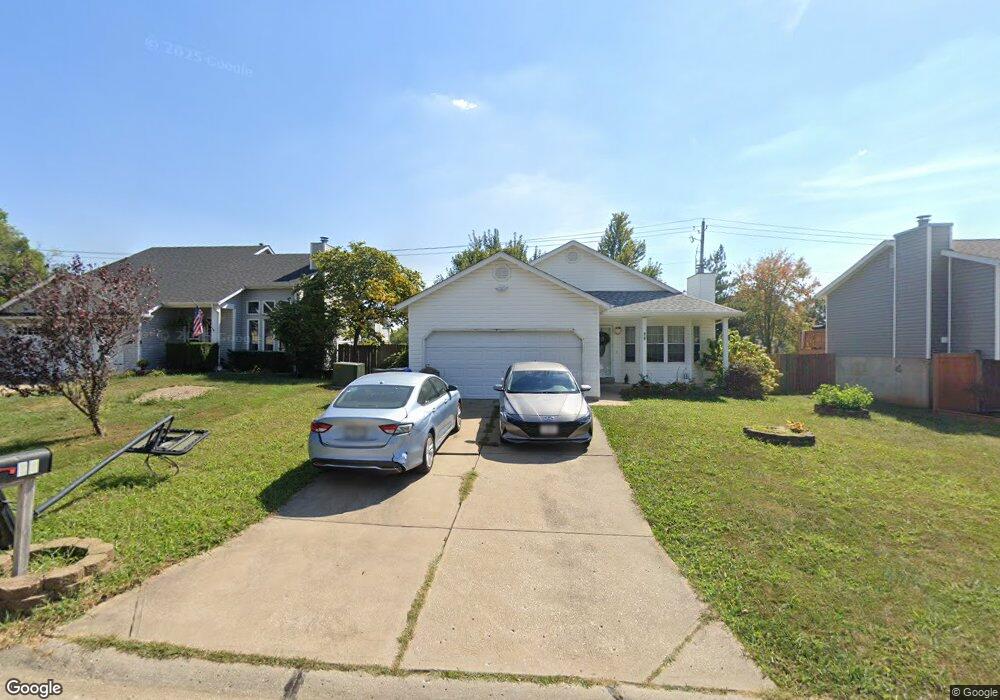
14 Rose Wind Ct O Fallon, MO 63366
Estimated Value: $269,004 - $314,000
3
Beds
2
Baths
1,049
Sq Ft
$274/Sq Ft
Est. Value
About This Home
This home is located at 14 Rose Wind Ct, O Fallon, MO 63366 and is currently estimated at $287,251, approximately $273 per square foot. 14 Rose Wind Ct is a home located in St. Charles County with nearby schools including Westhoff Elementary School, Fort Zumwalt North Middle School, and Fort Zumwalt North High School.
Ownership History
Date
Name
Owned For
Owner Type
Purchase Details
Closed on
Dec 3, 2020
Sold by
Siebert Douglas and Siebert Tammy
Bought by
Jd Investment Services Llc
Current Estimated Value
Home Financials for this Owner
Home Financials are based on the most recent Mortgage that was taken out on this home.
Original Mortgage
$84,000
Interest Rate
2.8%
Mortgage Type
New Conventional
Purchase Details
Closed on
Feb 9, 2015
Sold by
Siebert Douglas
Bought by
Jd Investment Services Llc
Purchase Details
Closed on
Jan 27, 2015
Sold by
Jd Investment Services Llc
Bought by
Siebert Douglas
Purchase Details
Closed on
Jul 22, 2013
Sold by
Siebert Douglas
Bought by
Jd Investment Services Llc
Home Financials for this Owner
Home Financials are based on the most recent Mortgage that was taken out on this home.
Original Mortgage
$95,250
Interest Rate
3.83%
Mortgage Type
New Conventional
Purchase Details
Closed on
Jul 2, 2013
Sold by
Hoff Alexander Michael and Hoff Amanda Marie
Bought by
Siebert Douglas
Home Financials for this Owner
Home Financials are based on the most recent Mortgage that was taken out on this home.
Original Mortgage
$95,250
Interest Rate
3.83%
Mortgage Type
New Conventional
Purchase Details
Closed on
Jan 29, 2010
Sold by
Advantage Properties Llc
Bought by
Hoff Alexander Michael and Meglio Amanda Marie
Home Financials for this Owner
Home Financials are based on the most recent Mortgage that was taken out on this home.
Original Mortgage
$132,554
Interest Rate
5.12%
Mortgage Type
FHA
Purchase Details
Closed on
Aug 6, 2009
Sold by
Reece Christine L and Reece David D
Bought by
Advantage Properties Llc
Purchase Details
Closed on
Aug 8, 1997
Sold by
Lindbergh Properties Inc
Bought by
Reece David D and Reece Christine L
Home Financials for this Owner
Home Financials are based on the most recent Mortgage that was taken out on this home.
Original Mortgage
$68,720
Interest Rate
11.5%
Create a Home Valuation Report for This Property
The Home Valuation Report is an in-depth analysis detailing your home's value as well as a comparison with similar homes in the area
Home Values in the Area
Average Home Value in this Area
Purchase History
| Date | Buyer | Sale Price | Title Company |
|---|---|---|---|
| Jd Investment Services Llc | -- | None Available | |
| Siebert Douglas | -- | None Available | |
| Jd Investment Services Llc | -- | -- | |
| Siebert Douglas | -- | None Available | |
| Jd Investment Services Llc | -- | None Available | |
| Siebert Douglas | -- | None Available | |
| Hoff Alexander Michael | -- | Ort | |
| Advantage Properties Llc | $85,221 | None Available | |
| Reece David D | -- | -- |
Source: Public Records
Mortgage History
| Date | Status | Borrower | Loan Amount |
|---|---|---|---|
| Previous Owner | Siebert Douglas | $84,000 | |
| Previous Owner | Siebert Douglas | $95,250 | |
| Previous Owner | Hoff Alexander Michael | $132,554 | |
| Previous Owner | Reece David D | $68,720 | |
| Closed | Reece David D | $12,000 |
Source: Public Records
Tax History
| Year | Tax Paid | Tax Assessment Tax Assessment Total Assessment is a certain percentage of the fair market value that is determined by local assessors to be the total taxable value of land and additions on the property. | Land | Improvement |
|---|---|---|---|---|
| 2025 | $2,881 | $43,875 | -- | -- |
| 2023 | $2,882 | $43,381 | $0 | $0 |
| 2022 | $2,551 | $35,682 | $0 | $0 |
| 2021 | $2,553 | $35,682 | $0 | $0 |
| 2020 | $2,223 | $30,089 | $0 | $0 |
| 2019 | $2,228 | $30,089 | $0 | $0 |
| 2018 | $1,982 | $25,525 | $0 | $0 |
| 2017 | $1,949 | $25,525 | $0 | $0 |
| 2016 | $1,831 | $23,883 | $0 | $0 |
| 2015 | $1,702 | $23,883 | $0 | $0 |
| 2014 | $1,620 | $22,355 | $0 | $0 |
Source: Public Records
Map
Nearby Homes
- 1358 Deerfield Estates Dr
- 1102 Danielle Elizabeth Ct
- 730 Homerun Dr Unit 76N
- 31 Piepers Glen Ct
- 1110 Cypress Dr
- 634 Homerun Dr Unit 34N
- 17 Homefield Gardens Dr
- 231 England Dr
- 6 S Boxwood Ln
- 2837 Grand Slam Dr
- 201 Allen Dr
- 1612 Homefield Meadows Dr
- 214 Maryland Dr Unit 26B
- 1818 Sapling Dr
- 409 Saint Joseph Ave
- 0 Tom Ginnever Ave
- 805 Saint Joseph Ave
- 487 Chatham Dr
- 34 Logan Crossing Cir
- 508 Saint Christopher Dr
- 12 Rose Wind Ct
- 16 Rose Wind Ct
- 10 Rose Wind Ct
- 3 Marie Lynn Place
- 5 Marie Lynn Place
- 18 Rose Wind Ct
- 5 Rose Wind Ct
- 1248 Begonia Dr
- 15 Rose Wind Ct
- 20 Rose Wind Ct
- 8 Rose Wind Ct
- 1254 Begonia Dr
- 17 Rose Wind Ct
- 6 Marie Lynn Place
- 1 Marie Lynn Place
- 19 Rose Wind Ct
- 6 Rose Wind Ct
- 1 Rose Wind Ct
- 4 Rose Wind Ct
- 1260 Begonia Dr
Your Personal Tour Guide
Ask me questions while you tour the home.