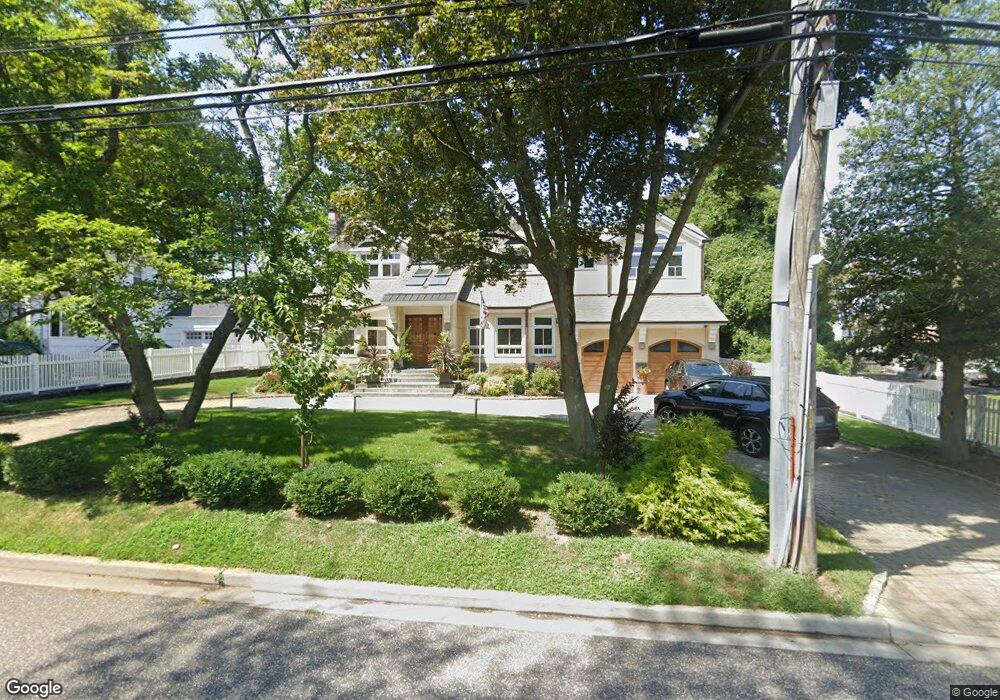
14 Townsend St Glen Head, NY 11545
Estimated Value: $1,334,000 - $1,696,557
3
Beds
6
Baths
3,220
Sq Ft
$471/Sq Ft
Est. Value
About This Home
This home is located at 14 Townsend St, Glen Head, NY 11545 and is currently estimated at $1,515,279, approximately $470 per square foot. 14 Townsend St is a home with nearby schools including North Shore Middle School, North Shore Senior High School, and Tiegerman Elementary School.
Ownership History
Date
Name
Owned For
Owner Type
Purchase Details
Closed on
Jun 12, 2013
Sold by
Spiridigliozzi Antonio and Spiridigliozzi Marie
Bought by
Spiridigliozzi Antonio and Spiridigliozzi Marie
Current Estimated Value
Purchase Details
Closed on
Jul 26, 2006
Sold by
Leib Charles
Bought by
Spiridigliozzi Antonio
Purchase Details
Closed on
Jun 17, 1997
Sold by
Executrix Leib Catherine
Bought by
Leib Charles G and De Louise Jr
Create a Home Valuation Report for This Property
The Home Valuation Report is an in-depth analysis detailing your home's value as well as a comparison with similar homes in the area
Home Values in the Area
Average Home Value in this Area
Purchase History
| Date | Buyer | Sale Price | Title Company |
|---|---|---|---|
| Spiridigliozzi Antonio | -- | -- | |
| Spiridigliozzi Antonio | -- | -- | |
| Spiridigliozzi Antonio | -- | -- | |
| Spiridigliozzi Antonio | $820,000 | -- | |
| Spiridigliozzi Antonio | $820,000 | -- | |
| Leib Charles G | $200,000 | -- | |
| Leib Charles G | $200,000 | -- |
Source: Public Records
Tax History
| Year | Tax Paid | Tax Assessment Tax Assessment Total Assessment is a certain percentage of the fair market value that is determined by local assessors to be the total taxable value of land and additions on the property. | Land | Improvement |
|---|---|---|---|---|
| 2025 | $23,039 | $1,008 | $279 | $729 |
| 2024 | $7,111 | $1,020 | $282 | $738 |
Source: Public Records
Map
Nearby Homes
- 13 Walnut St
- 2 T Coolidge Ave
- 14 Oaklawn Ave
- 14 Harbor Ln
- 856 Glen Cove Ave
- 8 Dumond Place
- 67 Kissam Ln
- 1 Private Ln
- 1 Pine Hill Terrace
- 20 Michaels Ln
- 3 Maple St
- 120 Glenwood Rd
- 117 Glenwood Rd
- 14 Maple St
- 736 Motts Cove Rd N
- 734 Motts Cove Rd N
- 732 Motts Cove Rd N
- 730 Motts Cove Rd N
- 112 Scudders Ln
- 10 Shore Rd Unit 108
Your Personal Tour Guide
Ask me questions while you tour the home.