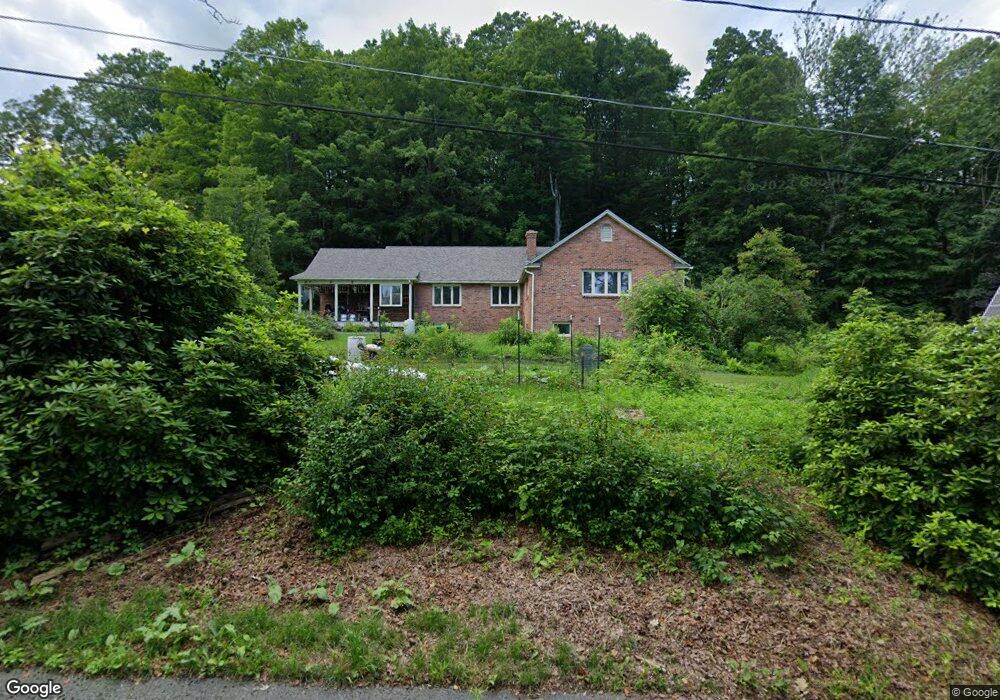
140 Academy Hill Rd Conway, MA 01341
Estimated Value: $423,000 - $472,000
3
Beds
2
Baths
1,834
Sq Ft
$242/Sq Ft
Est. Value
About This Home
This home is located at 140 Academy Hill Rd, Conway, MA 01341 and is currently estimated at $443,403, approximately $241 per square foot. 140 Academy Hill Rd is a home with nearby schools including Frontier Regional School.
Ownership History
Date
Name
Owned For
Owner Type
Purchase Details
Closed on
Apr 15, 2025
Sold by
Vande Kamp Elisa M and Vande Van De
Bought by
Vande Kamp Nickolas J
Current Estimated Value
Home Financials for this Owner
Home Financials are based on the most recent Mortgage that was taken out on this home.
Original Mortgage
$187,500
Outstanding Balance
$184,834
Interest Rate
6.67%
Mortgage Type
Second Mortgage Made To Cover Down Payment
Estimated Equity
$258,569
Purchase Details
Closed on
Jun 2, 2022
Sold by
Iken 2021 Ret and Van De Kamp
Bought by
Vandekamp Elisa M and Vandekamp Nicholas J
Purchase Details
Closed on
Jul 8, 2021
Sold by
Iken Marie J
Bought by
Iken 2021 Ret and Iken
Purchase Details
Closed on
Sep 1, 1976
Bought by
Iken Marie Jose
Create a Home Valuation Report for This Property
The Home Valuation Report is an in-depth analysis detailing your home's value as well as a comparison with similar homes in the area
Home Values in the Area
Average Home Value in this Area
Purchase History
| Date | Buyer | Sale Price | Title Company |
|---|---|---|---|
| Vande Kamp Nickolas J | -- | None Available | |
| Vande Kamp Nickolas J | -- | None Available | |
| Vandekamp Elisa M | -- | None Available | |
| Vandekamp Elisa M | -- | None Available | |
| Vandekamp Elisa M | -- | None Available | |
| Iken 2021 Ret | -- | None Available | |
| Iken 2021 Ret | -- | None Available | |
| Iken 2021 Ret | -- | None Available | |
| Iken Marie Jose | $28,000 | -- |
Source: Public Records
Mortgage History
| Date | Status | Borrower | Loan Amount |
|---|---|---|---|
| Open | Vande Kamp Nickolas J | $187,500 | |
| Previous Owner | Iken Marie Jose | $80,000 |
Source: Public Records
Tax History Compared to Growth
Tax History
| Year | Tax Paid | Tax Assessment Tax Assessment Total Assessment is a certain percentage of the fair market value that is determined by local assessors to be the total taxable value of land and additions on the property. | Land | Improvement |
|---|---|---|---|---|
| 2025 | $5,239 | $362,800 | $78,800 | $284,000 |
| 2024 | $4,643 | $283,100 | $71,600 | $211,500 |
| 2023 | $4,855 | $283,100 | $71,600 | $211,500 |
| 2022 | $4,708 | $262,300 | $66,400 | $195,900 |
| 2021 | $4,632 | $247,300 | $63,200 | $184,100 |
| 2020 | $4,489 | $239,300 | $63,200 | $176,100 |
| 2019 | $4,463 | $239,300 | $63,200 | $176,100 |
| 2018 | $4,237 | $229,000 | $63,200 | $165,800 |
| 2017 | $4,065 | $229,000 | $63,200 | $165,800 |
| 2016 | $3,666 | $219,800 | $55,200 | $164,600 |
| 2015 | $3,554 | $219,800 | $55,200 | $164,600 |
Source: Public Records
Map
Nearby Homes
- 0 Pleasant St
- 14 River St
- lot 1 Shelburne Falls Rd
- 71 Mathews Rd
- 85 Dacey Rd
- 473 N Poland Rd
- 30 Lee Rd
- 1531 Williamsburg Rd
- 230 S Ashfield Rd
- 820 E Guinea Rd
- 240 Beldingville Rd
- 208 Greenfield Rd
- 345 Greenfield Rd
- 24 Elm St
- 13 Capt Lathrop Dr
- 24 Graves St
- 32 Swamp Rd
- 0 North St Unit 73407299
- 33 Eastern Ave
- 15 Crestview Dr
- 129 Academy Hill Rd
- 8 Pleasant St
- 125 Academy Hill Rd
- 18 Pleasant St
- 104 Academy Hill Rd
- 9 Pleasant St
- 19 Boyden Rd
- 98 Academy Hill Rd
- 19 Bond St
- 16 Boyden Rd
- 39 Pleasant St
- 42 Boyden Rd
- 16 Bond St
- 69 Boyden Rd
- 85 Academy Hill Rd
- 62 Boyden Rd
- 192 Academy Hill Rd
- 105 Boyden Rd
- 68 Pleasant St
- 71 Academy Hill Rd