140 Hiway Ln International Falls, MN 56649
Estimated Value: $142,411 - $190,000
5
Beds
1
Bath
1,196
Sq Ft
$139/Sq Ft
Est. Value
About This Home
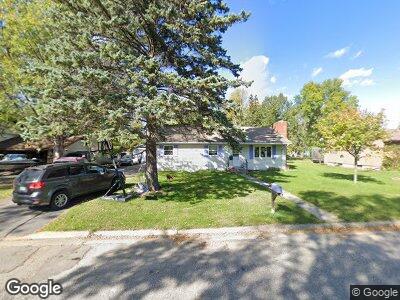
This home is located at 140 Hiway Ln, International Falls, MN 56649 and is currently estimated at $165,853, approximately $138 per square foot. 140 Hiway Ln is a home located in Koochiching County with nearby schools including Falls Elementary School, Falls Secondary School, and St. Thomas Aquinas Catholic School.
Ownership History
Date
Name
Owned For
Owner Type
Purchase Details
Closed on
Jun 7, 2021
Sold by
Rasmussen Kimberly K
Bought by
Elmberg Mckenzie K
Current Estimated Value
Home Financials for this Owner
Home Financials are based on the most recent Mortgage that was taken out on this home.
Original Mortgage
$115,000
Interest Rate
2.9%
Mortgage Type
Stand Alone Refi Refinance Of Original Loan
Purchase Details
Closed on
Jun 2, 2011
Sold by
Belding Shane G and Belding Paula E
Bought by
Rasmussen Kimberly K
Home Financials for this Owner
Home Financials are based on the most recent Mortgage that was taken out on this home.
Original Mortgage
$103,500
Interest Rate
4.81%
Mortgage Type
New Conventional
Create a Home Valuation Report for This Property
The Home Valuation Report is an in-depth analysis detailing your home's value as well as a comparison with similar homes in the area
Home Values in the Area
Average Home Value in this Area
Purchase History
| Date | Buyer | Sale Price | Title Company |
|---|---|---|---|
| Elmberg Mckenzie K | $115,000 | None Available | |
| Rasmussen Kimberly K | $97,000 | Minnesota Title & Abstract C | |
| Elmberg Mckenzie Mckenzie | $115,000 | -- |
Source: Public Records
Mortgage History
| Date | Status | Borrower | Loan Amount |
|---|---|---|---|
| Previous Owner | Elmberg Mckenzie K | $115,000 | |
| Previous Owner | Rasmussen Kimberly K | $103,500 | |
| Previous Owner | Belding Shaneg B | $15,000 | |
| Previous Owner | Belding Shane G | $10,000 | |
| Previous Owner | Belding Shane G | $80,500 | |
| Closed | Elmberg Mckenzie Mckenzie | $115,000 |
Source: Public Records
Tax History Compared to Growth
Tax History
| Year | Tax Paid | Tax Assessment Tax Assessment Total Assessment is a certain percentage of the fair market value that is determined by local assessors to be the total taxable value of land and additions on the property. | Land | Improvement |
|---|---|---|---|---|
| 2024 | $1,762 | $129,900 | $9,000 | $120,900 |
| 2023 | $1,762 | $129,900 | $9,000 | $120,900 |
| 2022 | $1,374 | $113,300 | $10,800 | $102,500 |
| 2021 | $1,148 | $96,100 | $17,200 | $78,900 |
| 2020 | $1,074 | $89,300 | $10,400 | $78,900 |
| 2019 | $1,036 | $86,300 | $10,400 | $75,900 |
| 2018 | $1,146 | $86,300 | $10,400 | $75,900 |
| 2017 | $950 | $95,300 | $10,400 | $84,900 |
| 2016 | $1,094 | $91,300 | $10,400 | $80,900 |
| 2015 | $1,168 | $99,000 | $10,400 | $88,600 |
| 2014 | -- | $108,900 | $11,400 | $97,500 |
| 2013 | -- | $99,000 | $10,400 | $88,600 |
Source: Public Records
Map
Nearby Homes