
Seller's Agent in 2026
Susan Cardinale
Sotheby’s International Realty
(831) 277-7600
1 in this area
46 Total Sales


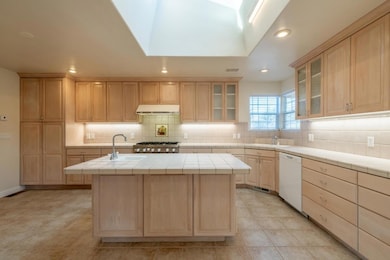

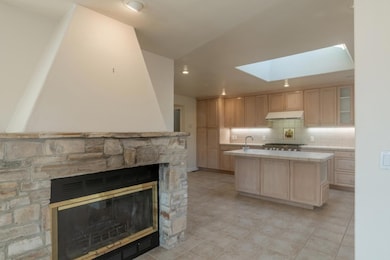
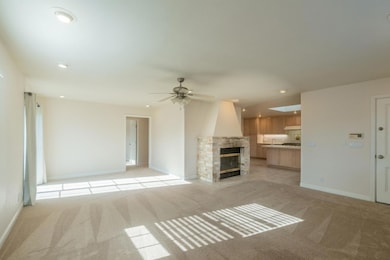
Discover this bright and welcoming Monterey home featuring 3 bedrooms and 2 bathrooms, thoughtfully designed for comfort and versatility. The expansive, light-filled kitchen showcases generous tile surfaces, a commercial range, and dual sinks an ideal space for cooking and gathering. An oversized laundry room adds convenience, with both downstairs bedrooms and the laundry offering direct access to the backyard. The deep, finished garage allows for tandem parking or the opportunity to imagine alternative uses such as a potential JADU (buyer to verify with the City of Monterey), home gym, or office. A classic Carmel-stone fireplace anchors the living area with warmth and character. The upstairs primary suite offers a peaceful retreat with a spacious ensuite bath, featuring a large tub and separate shower that open to a walk-in closet. A private view balcony fills the space with natural light. Additional highlights include a new roof (October 2025) and recently completed landscaping. The property underwent an extensive, permitted remodel in 1998, providing enduring quality and thoughtful upgrades throughout.
Last Agent to Sell the Property
Sotheby’s International Realty License #02045240 Listed on: 11/19/2025
| Date | Type | Sale Price | Title Company |
|---|---|---|---|
| Grant Deed | $1,070,000 | Chicago Title Company | |
| Interfamily Deed Transfer | -- | None Available | |
| Interfamily Deed Transfer | -- | None Available | |
| Interfamily Deed Transfer | -- | -- | |
| Interfamily Deed Transfer | -- | Stewart Title | |
| Interfamily Deed Transfer | -- | -- | |
| Grant Deed | -- | Stewart Title |
| Date | Status | Loan Amount | Loan Type |
|---|---|---|---|
| Previous Owner | $160,000 | No Value Available |
| Date | Event | Price | List to Sale | Price per Sq Ft |
|---|---|---|---|---|
| 01/09/2026 01/09/26 | Sold | $1,070,000 | -4.4% | $536 / Sq Ft |
| 01/01/2026 01/01/26 | Pending | -- | -- | -- |
| 11/19/2025 11/19/25 | For Sale | $1,119,000 | -- | $561 / Sq Ft |
| Year | Tax Paid | Tax Assessment Tax Assessment Total Assessment is a certain percentage of the fair market value that is determined by local assessors to be the total taxable value of land and additions on the property. | Land | Improvement |
|---|---|---|---|---|
| 2025 | $4,869 | $449,821 | $162,855 | $286,966 |
| 2024 | $4,869 | $441,002 | $159,662 | $281,340 |
| 2023 | $4,705 | $432,356 | $156,532 | $275,824 |
| 2022 | $4,639 | $423,879 | $153,463 | $270,416 |
| 2021 | $4,571 | $415,568 | $150,454 | $265,114 |
| 2020 | $4,399 | $411,308 | $148,912 | $262,396 |
| 2019 | $4,611 | $403,244 | $145,993 | $257,251 |
| 2018 | $4,428 | $395,338 | $143,131 | $252,207 |
| 2017 | $4,103 | $387,587 | $140,325 | $247,262 |
| 2016 | $4,029 | $379,988 | $137,574 | $242,414 |
| 2015 | $3,970 | $374,281 | $135,508 | $238,773 |
| 2014 | $3,902 | $366,950 | $132,854 | $234,096 |
Seller's Agent in 2026
Susan Cardinale
Sotheby’s International Realty
(831) 277-7600
1 in this area
46 Total Sales
Buyer's Agent in 2026
Teresa Giammanco-Valdez
Sotheby’s International Realty
(831) 915-0265
1 in this area
39 Total Sales
Source: MLSListings
MLS Number: ML82027933
APN: 013-046-006-000
Disclaimer: Certain information contained herein is derived from information provided by parties other than Homes.com. All information provided is deemed reliable, but is not guaranteed to be accurate and should be independently verified.
![]() Property Information © 2026 MLSListings Inc. All rights reserved. Listing information is deemed reliable but not guaranteed. Certain information contained herein is derived from information which is the licensed property of, and copyrighted by, MLSListings Inc. The viewer acknowledges ownership and validity of its copyright. Information provided is for personal, non-commercial use by a viewer with a bona fide interest in the purchase or sale of real estate of the type being offered via this website or other electronic means. The viewer is prohibited from copying, redistributing or retransmitting any of the data or information provided by MLSListing, Inc.
Property Information © 2026 MLSListings Inc. All rights reserved. Listing information is deemed reliable but not guaranteed. Certain information contained herein is derived from information which is the licensed property of, and copyrighted by, MLSListings Inc. The viewer acknowledges ownership and validity of its copyright. Information provided is for personal, non-commercial use by a viewer with a bona fide interest in the purchase or sale of real estate of the type being offered via this website or other electronic means. The viewer is prohibited from copying, redistributing or retransmitting any of the data or information provided by MLSListing, Inc.
Ask me questions while you tour the home.