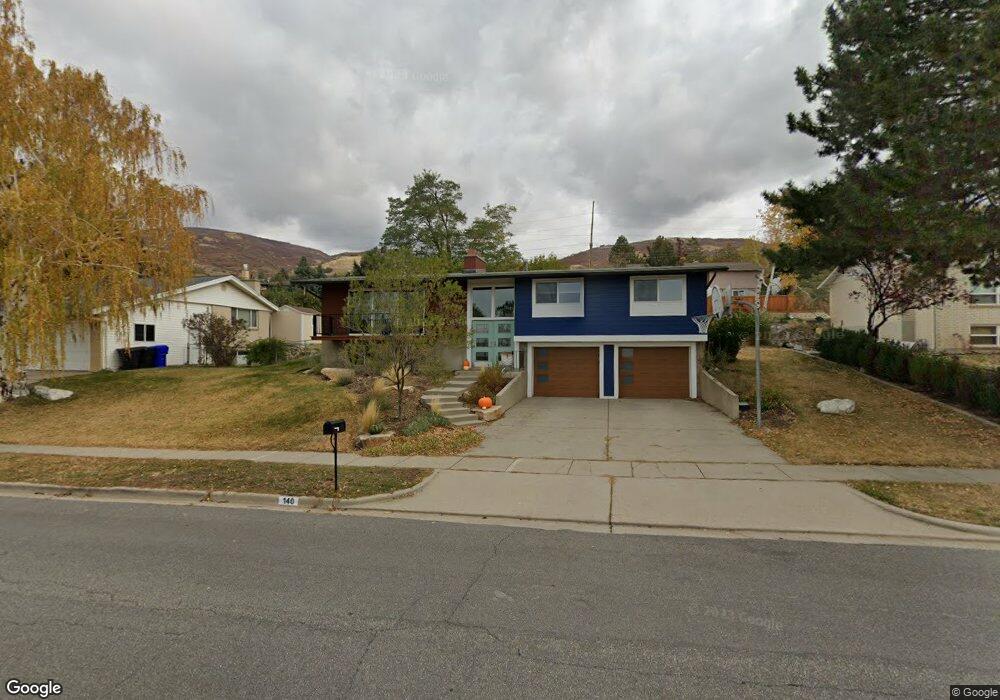
140 N 1050 E Bountiful, UT 84010
Estimated Value: $564,000 - $621,047
4
Beds
3
Baths
2,085
Sq Ft
$287/Sq Ft
Est. Value
About This Home
This home is located at 140 N 1050 E, Bountiful, UT 84010 and is currently estimated at $598,262, approximately $286 per square foot. 140 N 1050 E is a home located in Davis County with nearby schools including Holbrook Elementary School, Millcreek Junior High School, and Bountiful High School.
Ownership History
Date
Name
Owned For
Owner Type
Purchase Details
Closed on
May 5, 2022
Sold by
Hansen Benjamin C and Hansen Kira A
Bought by
Buck Tyler Curtis and Bachtar Melina Renee
Current Estimated Value
Home Financials for this Owner
Home Financials are based on the most recent Mortgage that was taken out on this home.
Original Mortgage
$622,250
Outstanding Balance
$590,382
Interest Rate
5.27%
Mortgage Type
New Conventional
Estimated Equity
$7,880
Purchase Details
Closed on
Aug 8, 2003
Sold by
Cipro Loretta
Bought by
Cipro Loretta
Home Financials for this Owner
Home Financials are based on the most recent Mortgage that was taken out on this home.
Original Mortgage
$130,900
Interest Rate
5.12%
Mortgage Type
Purchase Money Mortgage
Create a Home Valuation Report for This Property
The Home Valuation Report is an in-depth analysis detailing your home's value as well as a comparison with similar homes in the area
Purchase History
| Date | Buyer | Sale Price | Title Company |
|---|---|---|---|
| Buck Tyler Curtis | -- | South Valley Title | |
| Cipro Loretta | -- | Surety Title Agency |
Source: Public Records
Mortgage History
| Date | Status | Borrower | Loan Amount |
|---|---|---|---|
| Open | Buck Tyler Curtis | $622,250 | |
| Previous Owner | Cipro Loretta | $130,900 |
Source: Public Records
Tax History
| Year | Tax Paid | Tax Assessment Tax Assessment Total Assessment is a certain percentage of the fair market value that is determined by local assessors to be the total taxable value of land and additions on the property. | Land | Improvement |
|---|---|---|---|---|
| 2025 | $3,365 | $305,250 | $139,358 | $165,892 |
| 2024 | $3,167 | $297,550 | $128,402 | $169,148 |
| 2023 | $2,995 | $510,000 | $233,946 | $276,054 |
| 2022 | $2,856 | $265,650 | $124,732 | $140,918 |
| 2021 | $2,487 | $353,000 | $185,483 | $167,517 |
| 2020 | $2,196 | $312,000 | $168,868 | $143,132 |
| 2019 | $2,225 | $309,000 | $163,841 | $145,159 |
| 2018 | $2,054 | $280,000 | $152,537 | $127,463 |
| 2016 | $1,675 | $122,870 | $49,725 | $73,145 |
| 2015 | $1,584 | $109,230 | $49,725 | $59,505 |
| 2014 | $1,548 | $110,013 | $49,725 | $60,288 |
| 2013 | -- | $90,046 | $57,728 | $32,318 |
Source: Public Records
Map
Nearby Homes
- 1138 Briggs Dr
- 6 N 800 E
- 129 N 800 E
- 683 E 100 N
- 908 Northern Hills Dr Unit 3
- 933 Northern Hills Cir
- 1342 E Skyline Dr N Unit 30
- 331 S 1550 E Unit 3
- 144 Bountiful Blvd
- 111 Eagle Ridge Dr
- 513 N 400 E Unit 14B
- 453 N 400 E Unit 7-D
- 456 E 500 S
- 520 S Orchard Dr Unit 17
- 255 E 400 S
- 275 E Peach Ln S
- 323 Peach Ln
- 861 E Millbrook Way
- 0 Lot Bountiful Blvd
- 357 S 100 E
Your Personal Tour Guide
Ask me questions while you tour the home.