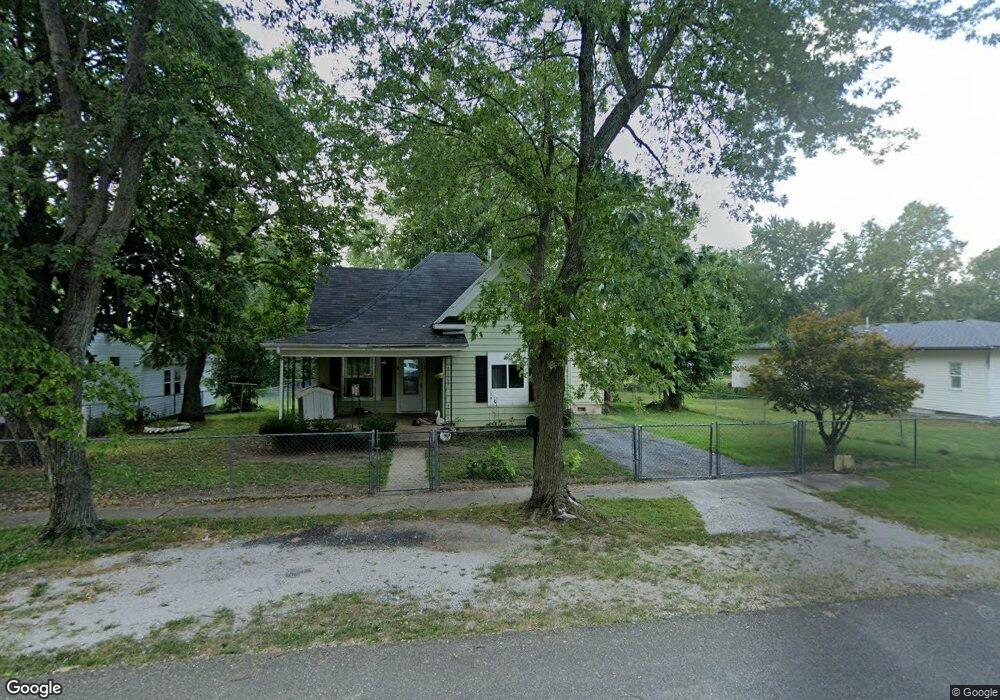
140 W Tyndal St Aurora, MO 65605
Estimated Value: $89,000 - $126,000
2
Beds
1
Bath
1,186
Sq Ft
$93/Sq Ft
Est. Value
About This Home
This home is located at 140 W Tyndal St, Aurora, MO 65605 and is currently estimated at $110,060, approximately $92 per square foot. 140 W Tyndal St is a home located in Lawrence County with nearby schools including Pate Early Childhood Center, Robinson Intermediate School, and Robinson Elementary School.
Ownership History
Date
Name
Owned For
Owner Type
Purchase Details
Closed on
Jun 7, 2019
Sold by
Pilkenton Scott and Pilkenton Kaye
Bought by
Gutierrez Jesus R
Current Estimated Value
Home Financials for this Owner
Home Financials are based on the most recent Mortgage that was taken out on this home.
Original Mortgage
$15,000
Outstanding Balance
$13,847
Interest Rate
7%
Mortgage Type
Seller Take Back
Estimated Equity
$96,213
Purchase Details
Closed on
May 15, 2019
Sold by
Eaves Debra
Bought by
Pilkenton Scott and Pilkenton Kaye
Home Financials for this Owner
Home Financials are based on the most recent Mortgage that was taken out on this home.
Original Mortgage
$15,000
Outstanding Balance
$13,847
Interest Rate
7%
Mortgage Type
Seller Take Back
Estimated Equity
$96,213
Purchase Details
Closed on
Jun 17, 2010
Sold by
Martin Elizabeth Barnes
Bought by
Eaves Debra
Purchase Details
Closed on
Apr 21, 2009
Sold by
Eaves Debra and Barnes Tonya
Bought by
Barnes Martin Elizabeth
Create a Home Valuation Report for This Property
The Home Valuation Report is an in-depth analysis detailing your home's value as well as a comparison with similar homes in the area
Home Values in the Area
Average Home Value in this Area
Purchase History
| Date | Buyer | Sale Price | Title Company |
|---|---|---|---|
| Gutierrez Jesus R | -- | None Available | |
| Pilkenton Scott | -- | None Available | |
| Eaves Debra | -- | -- | |
| Eaves Debra | -- | None Available | |
| Barnes Martin Elizabeth | -- | None Available |
Source: Public Records
Mortgage History
| Date | Status | Borrower | Loan Amount |
|---|---|---|---|
| Open | Gutierrez Jesus R | $15,000 |
Source: Public Records
Tax History Compared to Growth
Tax History
| Year | Tax Paid | Tax Assessment Tax Assessment Total Assessment is a certain percentage of the fair market value that is determined by local assessors to be the total taxable value of land and additions on the property. | Land | Improvement |
|---|---|---|---|---|
| 2025 | $396 | $7,920 | $1,670 | $6,250 |
| 2024 | $369 | $7,310 | $1,670 | $5,640 |
| 2023 | $367 | $7,310 | $1,670 | $5,640 |
| 2022 | $346 | $6,900 | $1,670 | $5,230 |
| 2021 | $346 | $6,900 | $1,670 | $5,230 |
| 2020 | $317 | $6,260 | $1,030 | $5,230 |
| 2019 | $312 | $6,260 | $1,030 | $5,230 |
| 2018 | $311 | $6,260 | $1,030 | $5,230 |
| 2017 | $310 | $6,260 | $1,030 | $5,230 |
| 2016 | -- | $5,740 | $1,030 | $4,710 |
| 2015 | -- | $5,740 | $1,030 | $4,710 |
| 2014 | -- | $5,740 | $1,030 | $4,710 |
Source: Public Records
Map
Nearby Homes
- 225 Morgan Ave
- 503 Mcnatt Ave
- 15 E Cofield St
- 111 W Cofield St
- 112 N Madison Ave
- 304 E Cofield St
- 238 E Delta St
- 141 W Pleasant St
- 109 W Cline St
- 000 Crescent St
- 311 W Pleasant St
- 216 S Elliott Ave
- 406 W Cline St
- 328 W Summit St
- Lot 2 Summit Grove Estates
- 220 S Park Ave
- 30 W College St
- 114 E College St
- 421 W College St
- 312 S Oak Ave
- 136 W Tyndal St
- 326 Morgan Ave
- 326 Morgan Ave
- 126 W Tyndall St
- 135 W Tyndal St
- 141 W Cofield St
- 135 Cofield St
- 141 W Tyndall St
- 147 W Tyndal St
- 131 W Tyndal St
- 145 Cofield St
- 325 Morgan Ave
- 121 W Tyndal St
- 114 W Tyndal St
- 123 Cofield St
- 205 W Tyndal St
- 205 W Tyndal St
- 309 Morgan Ave
- 205 W Tyndall St Unit 1208485
- 205 W Tyndall St