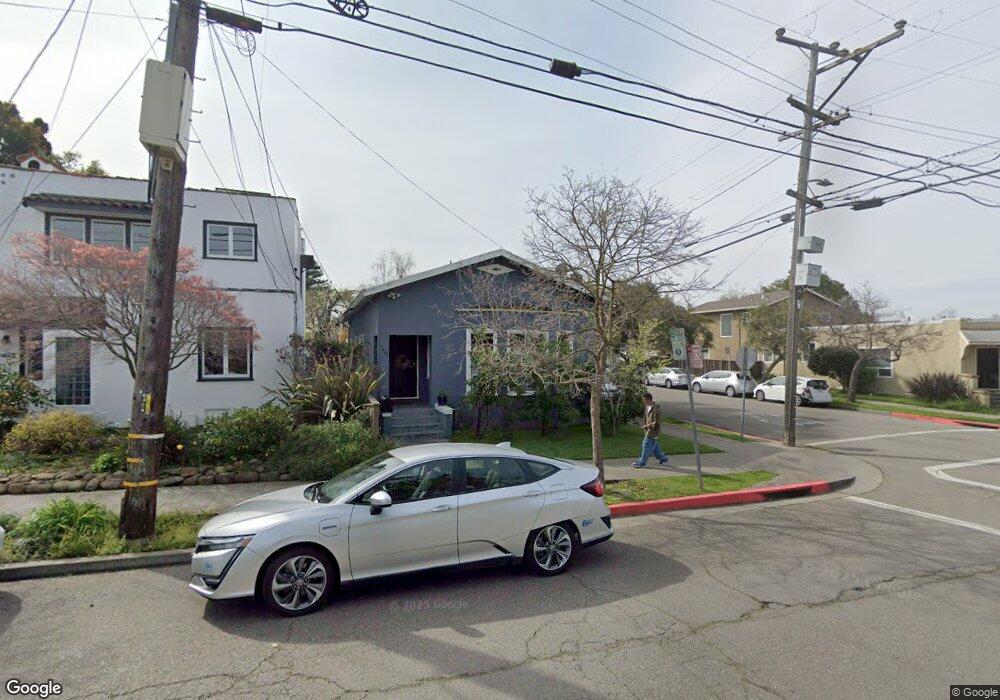
1400 Hearst Ave Berkeley, CA 94702
West Berkeley NeighborhoodEstimated Value: $1,095,000 - $1,315,000
2
Beds
1
Bath
977
Sq Ft
$1,192/Sq Ft
Est. Value
About This Home
This home is located at 1400 Hearst Ave, Berkeley, CA 94702 and is currently estimated at $1,164,208, approximately $1,191 per square foot. 1400 Hearst Ave is a home located in Alameda County with nearby schools including Ruth Acty Elementary, Rosa Parks Elementary School, and Berkeley Arts Magnet at Whittier School.
Ownership History
Date
Name
Owned For
Owner Type
Purchase Details
Closed on
Nov 26, 2019
Sold by
Neyhart Dirk
Bought by
Neyhart Dirk
Current Estimated Value
Home Financials for this Owner
Home Financials are based on the most recent Mortgage that was taken out on this home.
Original Mortgage
$431,000
Outstanding Balance
$381,099
Interest Rate
3.75%
Mortgage Type
New Conventional
Estimated Equity
$783,109
Purchase Details
Closed on
Dec 1, 2000
Sold by
Neyhart Dirk
Bought by
Neyhart Dirk
Purchase Details
Closed on
Oct 12, 1999
Sold by
Vancollie Craig A and Shimon Craig Arthur
Bought by
Vancollie Vancollie Shimon Craig Arthur Shimon Craig Arthur and Vancollie Shimon Craig Arthur
Create a Home Valuation Report for This Property
The Home Valuation Report is an in-depth analysis detailing your home's value as well as a comparison with similar homes in the area
Home Values in the Area
Average Home Value in this Area
Purchase History
| Date | Buyer | Sale Price | Title Company |
|---|---|---|---|
| Neyhart Dirk | -- | Chicago Title Company | |
| Neyhart Dirk | -- | Chicago Title Company | |
| Neyhart Dirk | -- | -- | |
| Vancollie Vancollie Shimon Craig Arthur Shimon Craig Arthur | -- | -- |
Source: Public Records
Mortgage History
| Date | Status | Borrower | Loan Amount |
|---|---|---|---|
| Open | Neyhart Dirk | $431,000 |
Source: Public Records
Tax History
| Year | Tax Paid | Tax Assessment Tax Assessment Total Assessment is a certain percentage of the fair market value that is determined by local assessors to be the total taxable value of land and additions on the property. | Land | Improvement |
|---|---|---|---|---|
| 2025 | $8,300 | $537,212 | $163,217 | $380,995 |
| 2024 | $8,300 | $526,542 | $160,017 | $373,525 |
| 2023 | $8,126 | $523,082 | $156,880 | $366,202 |
| 2022 | $7,979 | $505,828 | $153,805 | $359,023 |
| 2021 | $7,994 | $495,775 | $150,790 | $351,985 |
| 2020 | $7,580 | $497,622 | $149,244 | $348,378 |
| 2019 | $7,294 | $487,868 | $146,319 | $341,549 |
| 2018 | $7,171 | $478,303 | $143,450 | $334,853 |
| 2017 | $6,901 | $468,927 | $140,638 | $328,289 |
| 2016 | $6,683 | $459,734 | $137,881 | $321,853 |
| 2015 | $6,595 | $452,829 | $135,810 | $317,019 |
| 2014 | $6,551 | $443,959 | $133,150 | $310,809 |
Source: Public Records
Map
Nearby Homes
- 1411 Hearst Ave Unit 2
- 1436 Delaware St
- 1813 Sacramento St
- 1512 Hearst Ave Unit 1512
- 1322 Virginia St
- 1919 Curtis St
- 2118 California St
- 1482 Lincoln St
- 1207 Francisco St
- 1207 Francisco St Unit 2
- 1728 Curtis St
- 1564 Sacramento St
- 1128 Delaware St
- 2304 Edwards St
- 2231 Byron St
- 2350 Sacramento St
- 2218 -2222 Grant St
- 1609 Kains Ave
- 2324 Browning St
- 1450 Curtis St
- 1402 Hearst Ave
- 1404 Hearst Ave
- 1386 Hearst Ave
- 1406 Hearst Ave
- 1401 Berkeley Way
- 1405 Berkeley Way
- 1409 Berkeley Way
- 1382 Hearst Ave
- 1410 Hearst Ave
- 1411 Berkeley Way
- 1940 Acton St
- 1401 Hearst Ave
- 1380 Hearst Ave
- 1415 Berkeley Way
- 1412 Hearst Ave
- 1405 Hearst Ave
- 1393 Berkeley Way
- 1399 Hearst Ave
- 1407 Hearst Ave
- 1417 Berkeley Way
Your Personal Tour Guide
Ask me questions while you tour the home.