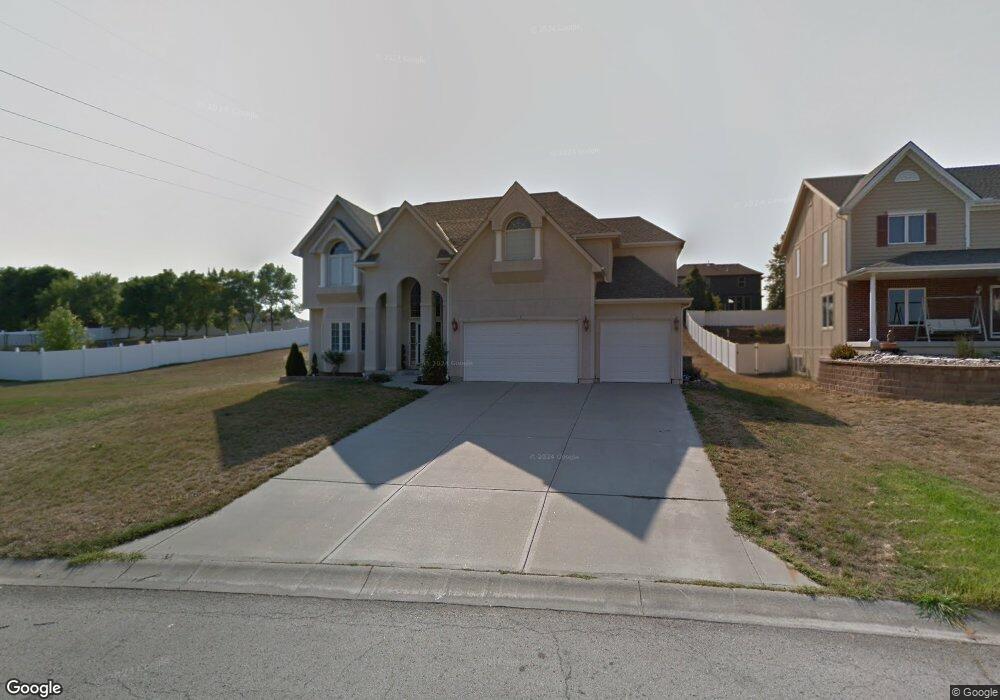
1400 NE Valley Forge Dr Lees Summit, MO 64086
Estimated Value: $486,000 - $656,000
4
Beds
4
Baths
2,844
Sq Ft
$202/Sq Ft
Est. Value
About This Home
This home is located at 1400 NE Valley Forge Dr, Lees Summit, MO 64086 and is currently estimated at $575,684, approximately $202 per square foot. 1400 NE Valley Forge Dr is a home located in Jackson County with nearby schools including Underwood Elementary School, Bernard C. Campbell Middle School, and Lee's Summit North High School.
Ownership History
Date
Name
Owned For
Owner Type
Purchase Details
Closed on
Jan 20, 2022
Sold by
Charles Grady David and Charles Louise Penny
Bought by
David C Grady And Penny L Grady Trust
Current Estimated Value
Purchase Details
Closed on
Jan 8, 2016
Sold by
Grady David Charles and Grady Penny Louise
Bought by
Grady David Charles and Grady Penny Louise
Purchase Details
Closed on
Oct 7, 2009
Sold by
Grady Lorinda Jean
Bought by
Grady David Charles
Purchase Details
Closed on
May 21, 2005
Sold by
Patterson Land Development Inc
Bought by
Grady David C and Grady Lorinda J
Purchase Details
Closed on
Aug 10, 2002
Sold by
Patterson Stanley L
Bought by
Patterson Land Development Inc
Purchase Details
Closed on
Apr 10, 2002
Sold by
Patterson Land Development Inc
Bought by
Patterson Stanley L
Create a Home Valuation Report for This Property
The Home Valuation Report is an in-depth analysis detailing your home's value as well as a comparison with similar homes in the area
Home Values in the Area
Average Home Value in this Area
Purchase History
| Date | Buyer | Sale Price | Title Company |
|---|---|---|---|
| David C Grady And Penny L Grady Trust | -- | None Listed On Document | |
| David C Grady And Penny L Grady Trust | -- | None Listed On Document | |
| Grady David Charles | -- | None Available | |
| Grady David Charles | -- | None Available | |
| Grady David C | -- | Coffelt Land Title Inc | |
| Patterson Land Development Inc | -- | Coffelt Land Title Inc | |
| Patterson Stanley L | -- | Coffelt Land Title |
Source: Public Records
Tax History Compared to Growth
Tax History
| Year | Tax Paid | Tax Assessment Tax Assessment Total Assessment is a certain percentage of the fair market value that is determined by local assessors to be the total taxable value of land and additions on the property. | Land | Improvement |
|---|---|---|---|---|
| 2025 | $7,406 | $100,006 | $8,316 | $91,690 |
| 2024 | $7,352 | $102,562 | $16,055 | $86,507 |
| 2023 | $7,352 | $102,562 | $8,865 | $93,697 |
| 2022 | $6,104 | $75,620 | $8,965 | $66,655 |
| 2021 | $6,231 | $75,620 | $8,965 | $66,655 |
| 2020 | $5,886 | $70,736 | $8,965 | $61,771 |
| 2019 | $5,725 | $70,736 | $8,965 | $61,771 |
| 2018 | $5,369 | $61,564 | $7,803 | $53,761 |
| 2017 | $5,289 | $61,564 | $7,803 | $53,761 |
| 2016 | $5,289 | $60,021 | $9,177 | $50,844 |
| 2014 | $5,565 | $61,912 | $8,580 | $53,332 |
Source: Public Records
Map
Nearby Homes
- 27008 E Olive Dr
- 27104 E Cedar Grove Dr
- 1408 NE Whitestone Dr
- 1220 NE Hendrix Dr
- 1424 NE Stonewood Dr
- 1425 NE Stonewood Dr
- 1632 NE Stonewood Dr
- 1637 NE Westwind Dr
- 1345 NE Foxwood Dr
- 1121 NE Ridgeview Dr
- 1809 NE Griffin Dr
- 801 NE Bryant Dr
- 1817 NE Burgandy Cir
- 1104 NE Ridgeview Dr
- 1717 NE Luther Rd
- 1404 NE Oakwood Dr
- 1400 NE Colbern Rd
- 713 NE Aaron Dr
- 629 NE Adams Dr
- 732 NE Deerbrook St
- 1404 NE Valley Forge Dr
- 1312 NE Valley Forge Dr
- 1403 NE Valley Forge Dr
- 1321 NE Country Ln
- 1325 NE Country Ln
- 1408 NE Valley Forge Dr
- 1407 NE Valley Forge Dr
- 1317 NE Country Ln
- 1315 NE Valley Forge Dr
- 1401 NE Country Ln
- 1308 NE Valley Forge Dr
- 1313 NE Country Ln
- 1405 NE Country Ln
- 1309 NE Valley Forge Dr
- 1412 NE Valley Forge Dr
- 1320 NE Country Ln
- 1304 NE Valley Forge Dr
- 1309 NE Country Ln
- 1324 NE Country Ln
- 1409 NE Country Ln