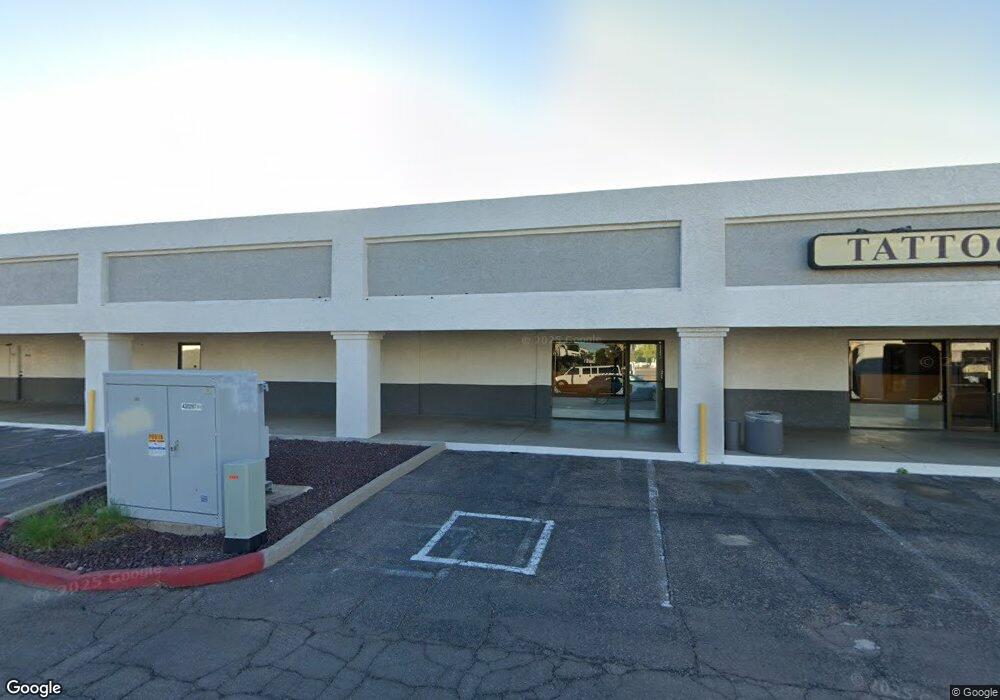
1400 S Mcclintock Dr Unit 10 Tempe, AZ 85281
Downtown Tempe NeighborhoodEstimated Value: $4,651,406
--
Bed
--
Bath
20,830
Sq Ft
$223/Sq Ft
Est. Value
About This Home
This home is located at 1400 S Mcclintock Dr Unit 10, Tempe, AZ 85281 and is currently estimated at $4,651,406, approximately $223 per square foot. 1400 S Mcclintock Dr Unit 10 is a home located in Maricopa County with nearby schools including Curry Elementary School, Connolly Middle School, and McClintock High School.
Ownership History
Date
Name
Owned For
Owner Type
Purchase Details
Closed on
Jan 1, 2000
Sold by
King Plaza Inc
Bought by
King Plaza Llc
Current Estimated Value
Purchase Details
Closed on
Jul 29, 1999
Sold by
Bp Properties
Bought by
King Plaza Inc
Home Financials for this Owner
Home Financials are based on the most recent Mortgage that was taken out on this home.
Original Mortgage
$822,000
Interest Rate
8.25%
Mortgage Type
Commercial
Purchase Details
Closed on
Mar 29, 1996
Sold by
Gabhron Corp
Bought by
B P Properties
Create a Home Valuation Report for This Property
The Home Valuation Report is an in-depth analysis detailing your home's value as well as a comparison with similar homes in the area
Home Values in the Area
Average Home Value in this Area
Purchase History
| Date | Buyer | Sale Price | Title Company |
|---|---|---|---|
| King Plaza Llc | -- | -- | |
| King Plaza Inc | $1,320,000 | Old Republic Title Agency | |
| B P Properties | $640,000 | First American Title |
Source: Public Records
Mortgage History
| Date | Status | Borrower | Loan Amount |
|---|---|---|---|
| Previous Owner | King Plaza Inc | $822,000 |
Source: Public Records
Tax History Compared to Growth
Tax History
| Year | Tax Paid | Tax Assessment Tax Assessment Total Assessment is a certain percentage of the fair market value that is determined by local assessors to be the total taxable value of land and additions on the property. | Land | Improvement |
|---|---|---|---|---|
| 2025 | $30,801 | $256,974 | -- | -- |
| 2024 | $30,216 | $252,386 | -- | -- |
| 2023 | $30,216 | $501,296 | $313,514 | $187,782 |
| 2022 | $29,837 | $291,481 | $112,438 | $179,043 |
| 2021 | $30,901 | $298,080 | $115,650 | $182,430 |
| 2020 | $29,963 | $305,406 | $118,602 | $186,804 |
| 2019 | $29,395 | $289,368 | $105,786 | $183,582 |
| 2018 | $28,665 | $299,718 | $115,560 | $184,158 |
| 2017 | $27,812 | $220,032 | $107,010 | $113,022 |
| 2016 | $27,616 | $195,948 | $93,042 | $102,906 |
| 2015 | $27,261 | $182,410 | $102,527 | $79,883 |
Source: Public Records
Map
Nearby Homes
- 1609 E Williams St
- 1831 E Apache Blvd Unit 102
- 1831 E Apache Blvd Unit 100
- 1622 E 12th St
- 1433 E Hudson Dr
- 1348 E Lemon St
- 1871 E Hayden Ln Unit D
- 1324 E Hall St
- 1886 E Don Carlos Ave Unit 165
- 1887 E Hayden Ln
- 1827 E Kirkland Ln Unit D
- 1831 E Kirkland Ln Unit B
- 2035 S Elm St Unit 226
- 2035 S Elm St Unit 138
- 924 S Casitas Dr Unit C
- 917 S Acapulco Ln Unit C
- 1229 E Spence Ave
- 834 S Casitas Dr Unit B
- 1445 E Broadway Rd Unit 120
- 1445 E Broadway Rd Unit 106
- 1400 S Mcclintock Dr Unit 9
- 1400 S Mcclintock Dr Unit 11
- 1400 S Mcclintock Dr Unit 12
- 1400 S Mcclintock Dr
- 1355 S Mcclintock Dr
- 1639 E Hudson Dr
- 1707 E Apache Blvd
- 1707 E Apache Blvd
- 1638 E Hudson Dr
- 1638 E Williams St Unit 1
- 1633 E Hudson Dr
- 1632 E Hudson Dr
- 1632 E Williams St
- 1401 S Mcclintock Dr
- 1627 E Hudson Dr
- 1626 E Hudson Dr
- 1626 E Williams St
- 1637 E Williams St
- 1811 E Apache Blvd Unit 2049
- 1811 E Apache Blvd Unit 1038