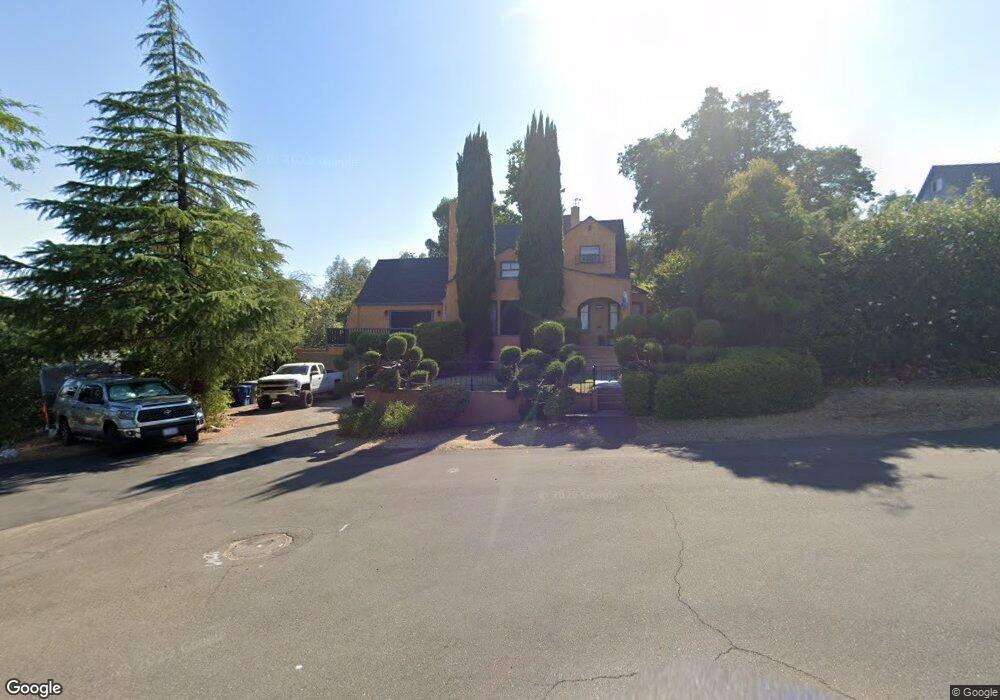
1400 Walnut Ave Redding, CA 96001
Magnolia NeighborhoodEstimated Value: $346,735 - $612,000
5
Beds
4
Baths
3,600
Sq Ft
$116/Sq Ft
Est. Value
About This Home
This home is located at 1400 Walnut Ave, Redding, CA 96001 and is currently estimated at $417,934, approximately $116 per square foot. 1400 Walnut Ave is a home located in Shasta County with nearby schools including Manzanita Elementary School, Sequoia Middle School, and Shasta High School.
Ownership History
Date
Name
Owned For
Owner Type
Purchase Details
Closed on
Oct 23, 2015
Sold by
Piper Gregory P and Piper Greg
Bought by
Piper Gregory P
Current Estimated Value
Home Financials for this Owner
Home Financials are based on the most recent Mortgage that was taken out on this home.
Original Mortgage
$267,500
Outstanding Balance
$210,395
Interest Rate
3.87%
Mortgage Type
New Conventional
Estimated Equity
$207,539
Purchase Details
Closed on
Aug 11, 2004
Sold by
Piper Greg
Bought by
Piper Greg
Home Financials for this Owner
Home Financials are based on the most recent Mortgage that was taken out on this home.
Original Mortgage
$204,500
Interest Rate
6.17%
Mortgage Type
New Conventional
Purchase Details
Closed on
Nov 2, 1998
Sold by
Gardner Piper Tracie Lee
Bought by
Piper Gregory P
Create a Home Valuation Report for This Property
The Home Valuation Report is an in-depth analysis detailing your home's value as well as a comparison with similar homes in the area
Home Values in the Area
Average Home Value in this Area
Purchase History
| Date | Buyer | Sale Price | Title Company |
|---|---|---|---|
| Piper Gregory P | -- | First American Title Company | |
| Piper Greg | -- | Placer Title Company | |
| Piper Gregory P | -- | First American Title Co |
Source: Public Records
Mortgage History
| Date | Status | Borrower | Loan Amount |
|---|---|---|---|
| Open | Piper Gregory P | $267,500 | |
| Closed | Piper Greg | $204,500 |
Source: Public Records
Tax History
| Year | Tax Paid | Tax Assessment Tax Assessment Total Assessment is a certain percentage of the fair market value that is determined by local assessors to be the total taxable value of land and additions on the property. | Land | Improvement |
|---|---|---|---|---|
| 2025 | $1,899 | $188,457 | $34,026 | $154,431 |
| 2024 | $1,868 | $184,762 | $33,359 | $151,403 |
| 2023 | $1,868 | $181,140 | $32,705 | $148,435 |
| 2022 | $1,835 | $177,589 | $32,064 | $145,525 |
| 2021 | $1,825 | $174,108 | $31,436 | $142,672 |
| 2020 | $1,848 | $172,324 | $31,114 | $141,210 |
| 2019 | $1,753 | $168,946 | $30,504 | $138,442 |
| 2018 | $1,786 | $165,634 | $29,906 | $135,728 |
| 2017 | $1,774 | $162,387 | $29,320 | $133,067 |
| 2016 | $1,716 | $159,204 | $28,746 | $130,458 |
| 2015 | $1,677 | $156,814 | $28,315 | $128,499 |
| 2014 | $1,664 | $153,743 | $27,761 | $125,982 |
Source: Public Records
Map
Nearby Homes
- 2565 North St
- 2327 Butte St
- 1545 Olive Ave
- 2315 Butte St
- 1170 Orange Ave
- 2351 Eureka Way
- 1129 Magnolia Ave
- 1377 Willis St
- 1777 Magnolia Ave
- 1525 Oak St
- 2036 Placer St
- 1025 Chardonnay Walk
- 3320 Stratford Ave
- 3126 Riesling Path
- 1355 Bambury Ct
- 3345 Oakwood Place
- 3024 West St
- 2381/2401 West St
- 2330 West St
- 2077 Skyline Dr
- 1356 Walnut Ave
- 1444 Walnut Ave
- 1385 Almond Ave
- 1405 Almond Ave
- 1346 Walnut Ave
- 2475 Tehama St
- 1415 Almond Ave Unit 1
- 1415 Almond Ave
- 1339 Almond Ave
- 1355 Almond Ave
- 1365 Walnut Ave
- 2457 Tehama St
- 1425 Almond Ave
- 1445 Almond Ave
- 1347 Walnut Ave
- 1337 Almond Ave
- 2602&2634 Butte St
- 1337 Walnut Ave
- 1317 Almond Ave
- 2558 Butte St
Your Personal Tour Guide
Ask me questions while you tour the home.