Estimated Value: $1,506,000 - $1,963,000
3
Beds
3
Baths
3,559
Sq Ft
$470/Sq Ft
Est. Value
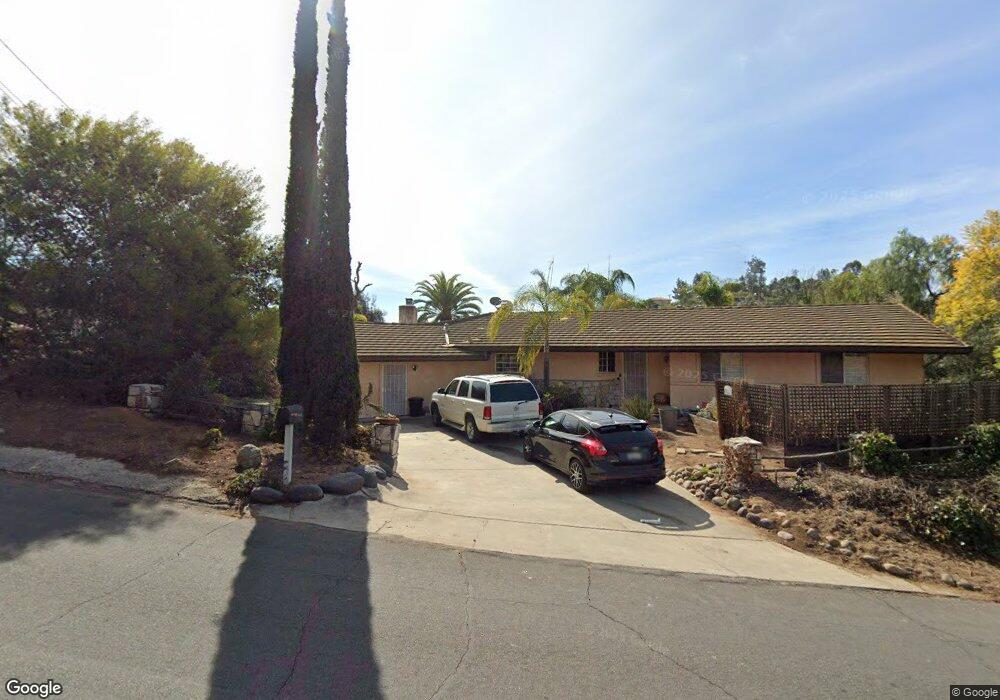
About This Home
This home is located at 14005 Ipava Dr, Poway, CA 92064 and is currently estimated at $1,671,232, approximately $469 per square foot. 14005 Ipava Dr is a home located in San Diego County with nearby schools including Midland Elementary, Twin Peaks Middle, and Poway High.
Ownership History
Date
Name
Owned For
Owner Type
Purchase Details
Closed on
May 20, 2023
Sold by
Cuevas Patrick D and Cuevas Maria C
Bought by
Cuevas Family Trust
Current Estimated Value
Purchase Details
Closed on
Mar 20, 2014
Sold by
Chmielinski Andrew B and Chmielinski Theresa
Bought by
Cuevas Patrick D and Cuevas Maria C
Home Financials for this Owner
Home Financials are based on the most recent Mortgage that was taken out on this home.
Original Mortgage
$540,000
Interest Rate
4.28%
Mortgage Type
New Conventional
Purchase Details
Closed on
Jul 16, 1997
Sold by
Chmielinski Andrew B
Bought by
Chmielinski Andrew B and Chmielinski Theresa
Home Financials for this Owner
Home Financials are based on the most recent Mortgage that was taken out on this home.
Original Mortgage
$252,000
Interest Rate
7.23%
Create a Home Valuation Report for This Property
The Home Valuation Report is an in-depth analysis detailing your home's value as well as a comparison with similar homes in the area
Home Values in the Area
Average Home Value in this Area
Purchase History
| Date | Buyer | Sale Price | Title Company |
|---|---|---|---|
| Cuevas Family Trust | -- | None Listed On Document | |
| Cuevas Patrick D | $675,000 | Title365 | |
| Chmielinski Andrew B | -- | Southland Title |
Source: Public Records
Mortgage History
| Date | Status | Borrower | Loan Amount |
|---|---|---|---|
| Previous Owner | Cuevas Patrick D | $540,000 | |
| Previous Owner | Chmielinski Andrew B | $252,000 |
Source: Public Records
Tax History
| Year | Tax Paid | Tax Assessment Tax Assessment Total Assessment is a certain percentage of the fair market value that is determined by local assessors to be the total taxable value of land and additions on the property. | Land | Improvement |
|---|---|---|---|---|
| 2025 | $9,102 | $827,448 | $478,082 | $349,366 |
| 2024 | $9,102 | $811,224 | $468,708 | $342,516 |
| 2023 | $8,908 | $779,724 | $450,508 | $329,216 |
| 2022 | $8,759 | $779,724 | $450,508 | $329,216 |
| 2021 | $8,645 | $764,436 | $441,675 | $322,761 |
| 2020 | $8,528 | $756,599 | $437,147 | $319,452 |
| 2019 | $8,306 | $741,765 | $428,576 | $313,189 |
| 2018 | $8,071 | $727,222 | $420,173 | $307,049 |
| 2017 | $170 | $712,964 | $411,935 | $301,029 |
| 2016 | $7,694 | $698,985 | $403,858 | $295,127 |
| 2015 | $7,579 | $688,486 | $397,792 | $290,694 |
| 2014 | $3,553 | $323,687 | $73,356 | $250,331 |
Source: Public Records
Map
Nearby Homes
- 14298 Ipava Dr
- 13643 Melissa Ln
- 13908 Hibiscus Ave Unit 40
- 13941 Wisteria Ave
- 13462 Montego Dr
- 000 Carlson Ct 9 Unit 9
- 13947 Midland Rd
- 14550 Dehia St
- 13428 Standish Dr
- 13419 Sebago Ave
- 13422 Little Dawn Ln
- 13209 Neddick Ave
- 14015 Olive Meadows Place
- 13619 Sycamore Tree Ln
- 13972 Poway Valley Rd
- 14523 Saco St
- 14610 Fairburn St
- 13435 Frey Ct
- 14403 Gaslight Ct
- 14525 Kittery St
- 14011 Ipava Dr
- 13755 Tierra Bonita Rd
- 13985 Ipava Dr
- 14004 Ipava Dr
- 14017 Ipava Dr
- 13729 Tierra Bonita Rd
- 13802 Savage Way
- 13982 Ipava Dr
- 13827 Tierra Bonita Rd
- 13973 Ipava Dr
- 13808 Savage Way
- 14023 Ipava Dr
- 13976 Ipava Dr
- 13711 Tierra Bonita Rd
- 13835 Tierra Bonita Rd
- 13814 Savage Way
- 13803 Savage Way
- 13957 Ipava Dr
- 13704 Tierra Bonita Rd
- 14107 Ipava Dr
Your Personal Tour Guide
Ask me questions while you tour the home.