Estimated Value: $310,256 - $334,000
3
Beds
5
Baths
1,806
Sq Ft
$178/Sq Ft
Est. Value
About This Home
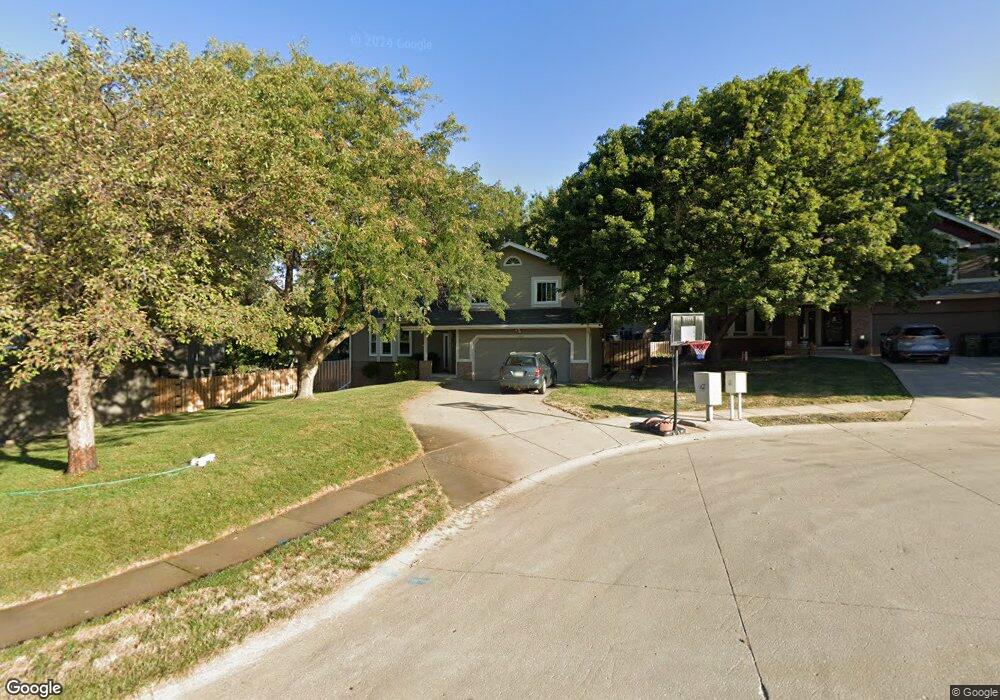
This home is located at 14012 Olive Cir, Omaha, NE 68138 and is currently estimated at $322,314, approximately $178 per square foot. 14012 Olive Cir is a home located in Sarpy County with nearby schools including Norman Rockwell Elementary School, Millard South High School, and Millard Central Middle School.
Ownership History
Date
Name
Owned For
Owner Type
Purchase Details
Closed on
Oct 13, 2006
Sold by
Donovan Sarabeth
Bought by
Holder Robert B and Holder Paula K
Current Estimated Value
Home Financials for this Owner
Home Financials are based on the most recent Mortgage that was taken out on this home.
Original Mortgage
$73,000
Outstanding Balance
$43,440
Interest Rate
6.41%
Estimated Equity
$278,874
Purchase Details
Closed on
Apr 22, 1998
Sold by
Miller Todd C and Miller Lisa D
Bought by
Donovan Sarabeth
Home Financials for this Owner
Home Financials are based on the most recent Mortgage that was taken out on this home.
Original Mortgage
$115,800
Interest Rate
7.09%
Create a Home Valuation Report for This Property
The Home Valuation Report is an in-depth analysis detailing your home's value as well as a comparison with similar homes in the area
Home Values in the Area
Average Home Value in this Area
Purchase History
| Date | Buyer | Sale Price | Title Company |
|---|---|---|---|
| Holder Robert B | $153,000 | Nlta | |
| Donovan Sarabeth | $122,000 | -- |
Source: Public Records
Mortgage History
| Date | Status | Borrower | Loan Amount |
|---|---|---|---|
| Open | Holder Robert B | $73,000 | |
| Previous Owner | Donovan Sarabeth | $115,800 |
Source: Public Records
Tax History Compared to Growth
Tax History
| Year | Tax Paid | Tax Assessment Tax Assessment Total Assessment is a certain percentage of the fair market value that is determined by local assessors to be the total taxable value of land and additions on the property. | Land | Improvement |
|---|---|---|---|---|
| 2025 | $3,743 | $265,039 | $52,000 | $213,039 |
| 2024 | $3,743 | $251,972 | $46,000 | $205,972 |
| 2023 | $4,022 | $223,059 | $39,000 | $184,059 |
| 2022 | $3,924 | $201,742 | $37,000 | $164,742 |
| 2021 | $3,664 | $183,319 | $35,000 | $148,319 |
| 2020 | $3,346 | $175,314 | $35,000 | $140,314 |
| 2019 | $3,230 | $168,472 | $35,000 | $133,472 |
| 2018 | $3,076 | $156,449 | $28,000 | $128,449 |
| 2017 | $2,900 | $150,207 | $28,000 | $122,207 |
| 2016 | $3,115 | $145,255 | $28,000 | $117,255 |
| 2015 | $3,075 | $142,548 | $28,000 | $114,548 |
| 2014 | $2,945 | $136,121 | $28,000 | $108,121 |
| 2012 | -- | $133,050 | $28,000 | $105,050 |
Source: Public Records
Map
Nearby Homes
- 7320 S 140th Ave
- 14020 Margo St
- 13952 Frederick Cir
- 7110 S 141st St
- 13918 Edna St
- 13713 Chandler St
- 7106 S 145th St
- 13703 Edna St
- 14619 Willow Creek Dr
- 14709 Willow Creek Dr
- 14712 Gertrude St
- 6610 S 139th St
- 14728 Gertrude St
- 6613 S 139th Cir
- 14743 Gertrude St
- 14537 Drexel St
- 13433 Edna St
- 7520 S 135th St
- 14910 Edna St
- 13418 Olive St
- 14102 Olive Cir
- 14008 Olive Cir
- 14106 Olive Cir
- 14107 Frederick Cr
- 14107 Frederick Cir
- 14103 Frederick Cir
- 14004 Olive Cir
- 14009 Frederick Cir
- 14111 Frederick Cir
- 14009 Frederick Cir
- 14110 Olive Cir
- 14015 Olive Cir
- 14101 Olive Cir
- 14003 Olive Cir
- 14011 Olive Cir
- 14105 Olive Cir
- 14115 Frederick Cir
- 14005 Frederick Cir
- 14007 Olive Cir
- 14114 Olive Cir