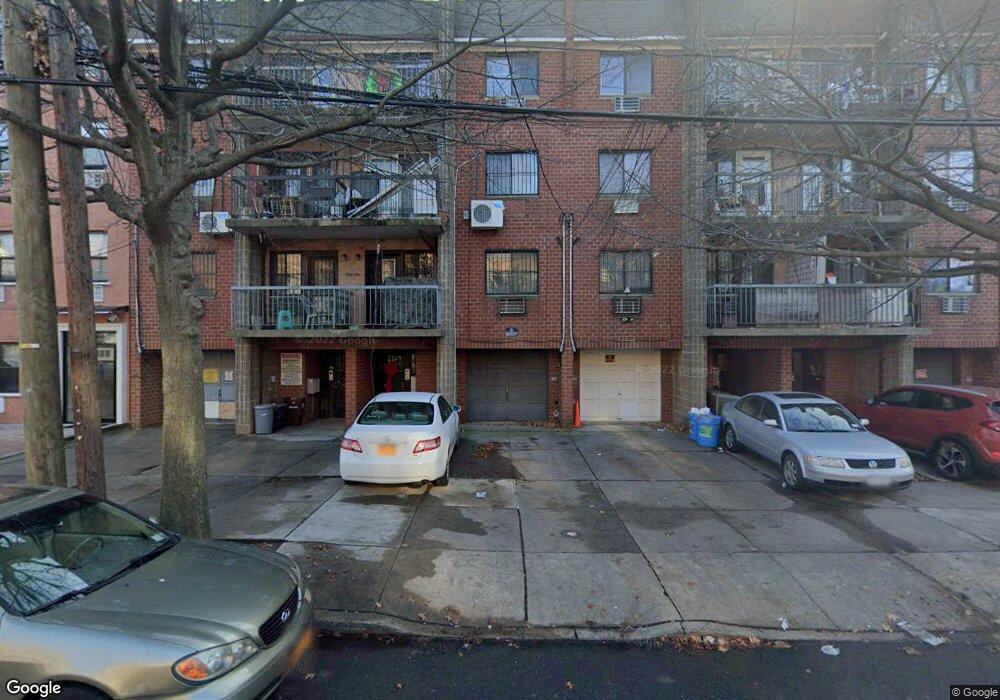
14018 33rd Ave Unit 104 Flushing, NY 11354
Flushing NeighborhoodEstimated Value: $525,521 - $618,000
--
Bed
--
Bath
796
Sq Ft
$725/Sq Ft
Est. Value
About This Home
This home is located at 14018 33rd Ave Unit 104, Flushing, NY 11354 and is currently estimated at $577,130, approximately $725 per square foot. 14018 33rd Ave Unit 104 is a home located in Queens County with nearby schools including P.S. 214 Cadwallader Colden, Jhs 185 Edward Bleeker, and Flushing High School.
Ownership History
Date
Name
Owned For
Owner Type
Purchase Details
Closed on
Mar 21, 2015
Sold by
Diaz Luis F and Diaz Natalia
Bought by
Diaz Natalia
Current Estimated Value
Purchase Details
Closed on
Jun 30, 2006
Sold by
Baek Jin Uk
Bought by
Diaz Natalia and Diaz Luis F
Home Financials for this Owner
Home Financials are based on the most recent Mortgage that was taken out on this home.
Original Mortgage
$86,520
Interest Rate
6.71%
Purchase Details
Closed on
Oct 26, 2005
Sold by
33 Union Associates
Bought by
Baek Jin Uk
Home Financials for this Owner
Home Financials are based on the most recent Mortgage that was taken out on this home.
Original Mortgage
$248,000
Interest Rate
5.93%
Mortgage Type
Purchase Money Mortgage
Create a Home Valuation Report for This Property
The Home Valuation Report is an in-depth analysis detailing your home's value as well as a comparison with similar homes in the area
Home Values in the Area
Average Home Value in this Area
Purchase History
| Date | Buyer | Sale Price | Title Company |
|---|---|---|---|
| Diaz Natalia | -- | -- | |
| Diaz Natalia | $432,600 | -- | |
| Diaz Natalia | $432,600 | -- | |
| Baek Jin Uk | $310,000 | -- | |
| Baek Jin Uk | $310,000 | -- |
Source: Public Records
Mortgage History
| Date | Status | Borrower | Loan Amount |
|---|---|---|---|
| Previous Owner | Diaz Natalia | $86,520 | |
| Previous Owner | Diaz Natalia | $346,080 | |
| Previous Owner | Baek Jin Uk | $248,000 |
Source: Public Records
Tax History Compared to Growth
Tax History
| Year | Tax Paid | Tax Assessment Tax Assessment Total Assessment is a certain percentage of the fair market value that is determined by local assessors to be the total taxable value of land and additions on the property. | Land | Improvement |
|---|---|---|---|---|
| 2025 | $4,411 | $40,613 | $4,944 | $35,669 |
| 2024 | $3,187 | $37,605 | $5,490 | $32,115 |
| 2023 | $4,063 | $34,819 | $6,675 | $28,144 |
| 2022 | $2,894 | $35,280 | $6,100 | $29,180 |
| 2021 | $2,976 | $36,109 | $6,100 | $30,009 |
| 2020 | $3,324 | $39,610 | $6,100 | $33,510 |
| 2019 | $3,096 | $36,477 | $6,100 | $30,377 |
| 2018 | $5,477 | $45,392 | $6,072 | $39,320 |
| 2017 | $5,127 | $42,030 | $5,960 | $36,070 |
| 2016 | $4,713 | $42,030 | $5,960 | $36,070 |
| 2015 | $2,507 | $38,918 | $5,979 | $32,939 |
| 2014 | $2,507 | $37,710 | $5,766 | $31,944 |
Source: Public Records
Map
Nearby Homes
- 14110 32nd Ave
- 140-21 32nd Ave Unit 5Cn
- 140-21 32nd Ave Unit 6F-N
- 140-21 32nd Ave Unit 6J
- 140-21 32nd Ave Unit 7FN
- 32-26 Union St Unit 6C
- 140-07 32nd Ave
- 14021 32nd Ave Unit 5C
- 140-03 32nd Ave
- 31-90 140th St Unit 2B
- 140-24 31st Dr Unit 2C
- 31-22 Union St Unit 2D
- 31-18 Union St Unit 3B
- 31-65 138th St Unit 3K
- 139-30 34th Ave Unit 3B
- 139-30 34th Ave Unit 4C
- 14134 33rd Ave Unit 2D
- 31-12 Union St Unit 4A
- 140-33 34th Ave Unit 5C
- 140-33 34th Ave Unit 2B
- 14018 33rd Ave Unit 103
- 14018 33rd Ave Unit 103
- 14018 33rd Ave Unit 102
- 14018 33rd Ave Unit 101
- 14018 33rd Ave
- 14018 33rd Ave Unit 105
- 14018 33rd Ave Unit 105
- 14018 33rd Ave
- 14018 33rd Ave Unit 102
- 14018 33rd Ave Unit 4
- 14018 33rd Ave Unit 4 FL
- 14018 33rd Ave Unit 1FL
- 14018 33rd Ave Unit 4 FL
- 14018 33rd Ave Unit 4th
- 14018 33rd Ave Unit 3FL
- 14018 33rd Ave Unit 101
- 14016 33rd Ave Unit 104
- 14016 33rd Ave Unit 103
- 14016 33rd Ave Unit 102
- 14016 33rd Ave Unit 101