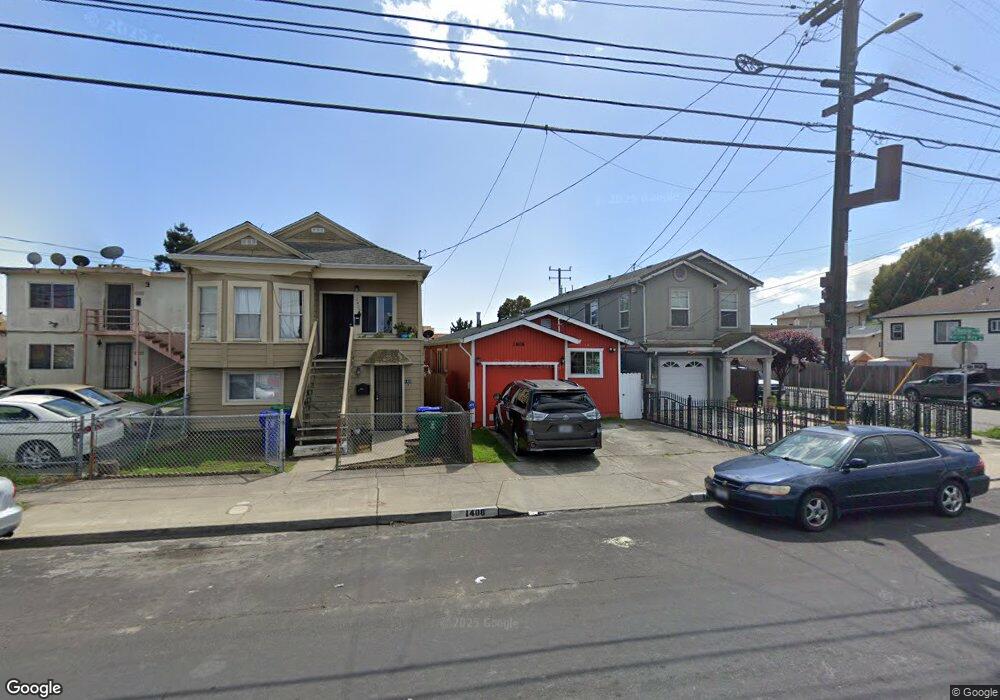
1404 Chanslor Ave Richmond, CA 94801
City Central NeighborhoodEstimated Value: $399,000 - $525,000
3
Beds
2
Baths
940
Sq Ft
$490/Sq Ft
Est. Value
About This Home
This home is located at 1404 Chanslor Ave, Richmond, CA 94801 and is currently estimated at $460,545, approximately $489 per square foot. 1404 Chanslor Ave is a home located in Contra Costa County with nearby schools including Nystrom Elementary School, Lovonya DeJean Middle School, and John F. Kennedy High School.
Ownership History
Date
Name
Owned For
Owner Type
Purchase Details
Closed on
May 16, 2012
Sold by
Community First Development Llc
Bought by
Ayala Marvin A and Ayala Eliduvina Navarrette
Current Estimated Value
Home Financials for this Owner
Home Financials are based on the most recent Mortgage that was taken out on this home.
Original Mortgage
$118,675
Outstanding Balance
$82,532
Interest Rate
3.98%
Mortgage Type
FHA
Estimated Equity
$378,013
Purchase Details
Closed on
Oct 21, 2011
Sold by
Hsbc Bank Usa National Association
Bought by
Community First Development Fund Llc
Home Financials for this Owner
Home Financials are based on the most recent Mortgage that was taken out on this home.
Original Mortgage
$50,185
Interest Rate
3.94%
Mortgage Type
Purchase Money Mortgage
Purchase Details
Closed on
Aug 9, 2011
Sold by
Rubin Lawrence Albert and Rubin Brenda Devon
Bought by
Hsbc Bank Usa National Association
Create a Home Valuation Report for This Property
The Home Valuation Report is an in-depth analysis detailing your home's value as well as a comparison with similar homes in the area
Home Values in the Area
Average Home Value in this Area
Purchase History
| Date | Buyer | Sale Price | Title Company |
|---|---|---|---|
| Ayala Marvin A | $125,000 | Old Republic Title Company | |
| Community First Development Fund Llc | $69,500 | First American Title Insuran | |
| Hsbc Bank Usa National Association | $95,000 | Accommodation |
Source: Public Records
Mortgage History
| Date | Status | Borrower | Loan Amount |
|---|---|---|---|
| Open | Ayala Marvin A | $118,675 | |
| Previous Owner | Community First Development Fund Llc | $50,185 |
Source: Public Records
Tax History
| Year | Tax Paid | Tax Assessment Tax Assessment Total Assessment is a certain percentage of the fair market value that is determined by local assessors to be the total taxable value of land and additions on the property. | Land | Improvement |
|---|---|---|---|---|
| 2025 | $3,719 | $156,996 | $18,837 | $138,159 |
| 2024 | $3,626 | $153,918 | $18,468 | $135,450 |
| 2023 | $3,626 | $150,901 | $18,106 | $132,795 |
| 2022 | $3,529 | $147,943 | $17,751 | $130,192 |
| 2021 | $3,458 | $145,043 | $17,403 | $127,640 |
| 2019 | $3,238 | $140,743 | $16,888 | $123,855 |
| 2018 | $3,117 | $137,984 | $16,557 | $121,427 |
| 2017 | $3,029 | $135,280 | $16,233 | $119,047 |
| 2016 | $2,960 | $132,628 | $15,915 | $116,713 |
| 2015 | $2,920 | $130,636 | $15,676 | $114,960 |
| 2014 | $2,898 | $128,078 | $15,369 | $112,709 |
Source: Public Records
Map
Nearby Homes
- 1532 Chanslor Ave
- 1532 Chanslor Ave Unit T
- 1532 Chanslor Ave
- 1401 Bissell Ave
- 227 15th St
- 228 15th St
- 143 19th St
- 249 S 13th St
- 146 19th St
- 130 Maine Ave
- 901 Florida Ave
- 2031 Chanslor Ave
- 2107 Ohio Ave
- 125 7th St
- 421 Metro Walk Way
- 812 Maine Ave
- 733 Maine Ave
- 447 S 16th St
- 278 6th St
- 1827 Barrett Ave
- 1408 Chanslor Ave Unit B
- 1408 Chanslor Ave
- 1400 Chanslor Ave
- 1412 Chanslor Ave
- 36 Marina Way
- 1420 Chanslor Ave
- 1334 Chanslor Ave
- 33 15th St
- 1326 Chanslor Ave
- 1432 Chanslor Ave
- 1407 Chanslor Ave
- 1322 Chanslor Ave
- 4 Marina Way
- 1419 Chanslor Ave
- 1329 Chanslor Ave
- 19 15th St
- 1423 Chanslor Ave
- 1318 Chanslor Ave
- 113 Marina Way
- 17 15th St
Your Personal Tour Guide
Ask me questions while you tour the home.