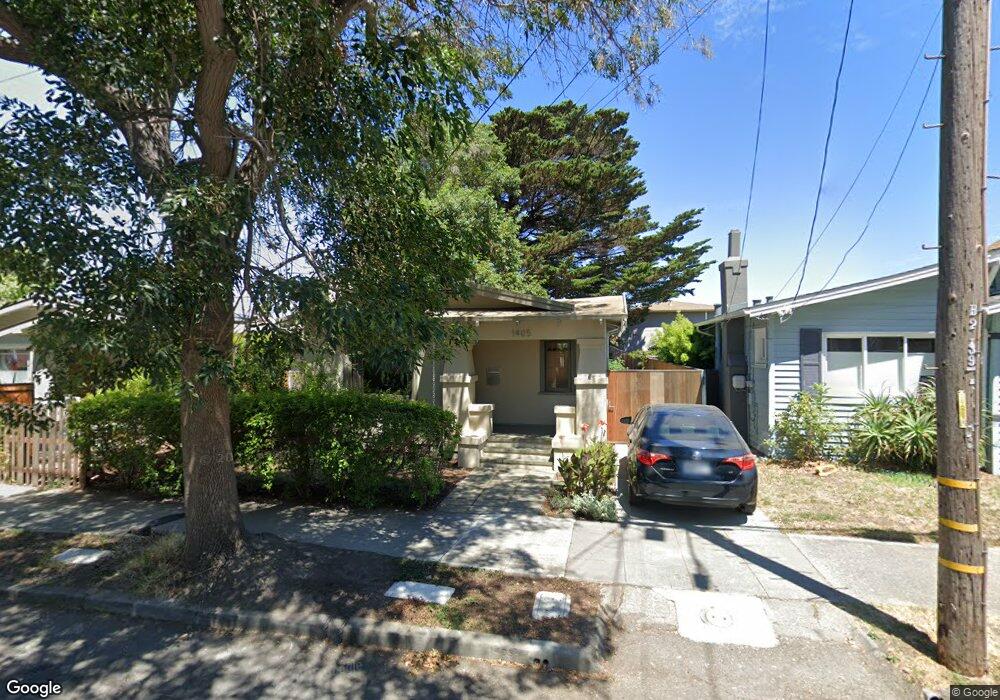
1405 66th St Berkeley, CA 94702
West Berkeley NeighborhoodEstimated Value: $760,000 - $1,143,000
2
Beds
1
Bath
933
Sq Ft
$1,022/Sq Ft
Est. Value
About This Home
This home is located at 1405 66th St, Berkeley, CA 94702 and is currently estimated at $953,562, approximately $1,022 per square foot. 1405 66th St is a home located in Alameda County with nearby schools including Malcolm X Elementary School, Washington Elementary School, and Oxford Elementary School.
Ownership History
Date
Name
Owned For
Owner Type
Purchase Details
Closed on
Jun 28, 2005
Sold by
Barrett Rachel R
Bought by
Miller James and Jacks Lisa
Current Estimated Value
Home Financials for this Owner
Home Financials are based on the most recent Mortgage that was taken out on this home.
Original Mortgage
$359,650
Outstanding Balance
$186,770
Interest Rate
5.58%
Mortgage Type
Purchase Money Mortgage
Estimated Equity
$766,792
Create a Home Valuation Report for This Property
The Home Valuation Report is an in-depth analysis detailing your home's value as well as a comparison with similar homes in the area
Home Values in the Area
Average Home Value in this Area
Purchase History
| Date | Buyer | Sale Price | Title Company |
|---|---|---|---|
| Miller James | $450,000 | First American Title Co |
Source: Public Records
Mortgage History
| Date | Status | Borrower | Loan Amount |
|---|---|---|---|
| Open | Miller James | $359,650 |
Source: Public Records
Tax History
| Year | Tax Paid | Tax Assessment Tax Assessment Total Assessment is a certain percentage of the fair market value that is determined by local assessors to be the total taxable value of land and additions on the property. | Land | Improvement |
|---|---|---|---|---|
| 2025 | $9,246 | $614,906 | $184,472 | $430,434 |
| 2024 | $9,246 | $602,851 | $180,855 | $421,996 |
| 2023 | $9,056 | $591,034 | $177,310 | $413,724 |
| 2022 | $8,816 | $572,446 | $173,834 | $405,612 |
| 2021 | $8,837 | $561,088 | $170,426 | $397,662 |
| 2020 | $8,389 | $562,265 | $168,679 | $393,586 |
| 2019 | $8,085 | $551,244 | $165,373 | $385,871 |
| 2018 | $7,952 | $540,440 | $162,132 | $378,308 |
| 2017 | $7,658 | $529,847 | $158,954 | $370,893 |
| 2016 | $7,426 | $519,461 | $155,838 | $363,623 |
| 2015 | $7,329 | $511,663 | $153,499 | $358,164 |
| 2014 | $6,268 | $420,000 | $126,000 | $294,000 |
Source: Public Records
Map
Nearby Homes
- 3101 Sacramento St
- 1507 Prince St
- 3224 Sacramento St
- 3138 California St
- 3114 California St
- 3110 California St
- 3032 Mabel St
- 1314 Ashby Ave
- 3214 California St
- 6628 Helen Ct
- 1080 67th St
- 2922 Stanton St
- 968 62nd St
- 6500 San Pablo Ave
- 1237 Ashby Ave
- 6501 San Pablo Ave Unit 410
- 1535 Julia St
- 6465 San Pablo Ave Unit 203
- 1126 Ocean Ave
- 1646 Ashby Ave
Your Personal Tour Guide
Ask me questions while you tour the home.