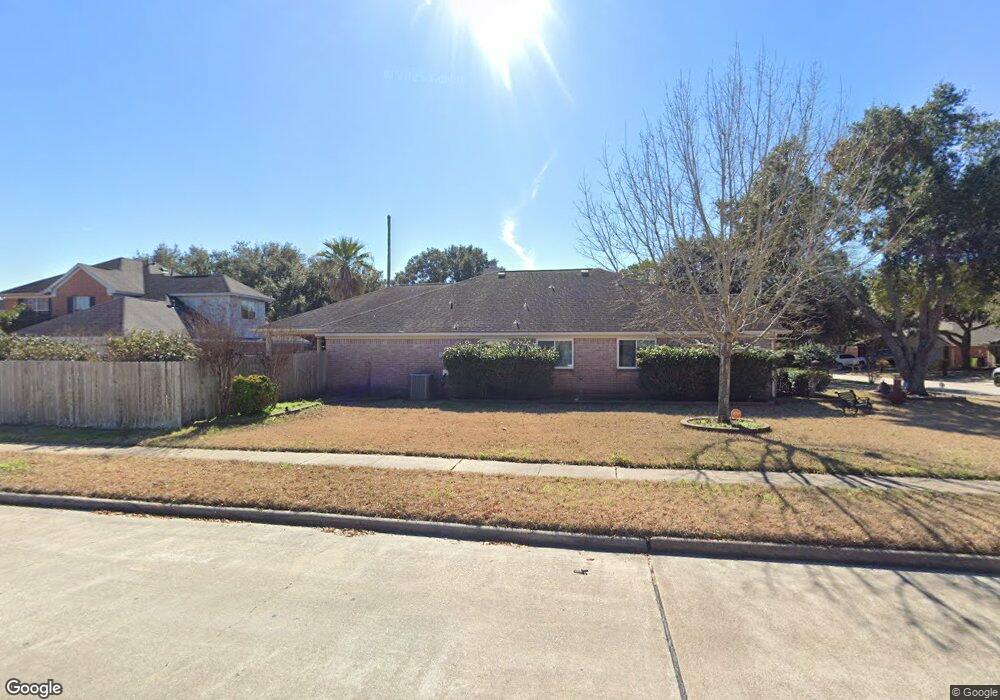
1405 Caslyn Dr Rosenberg, TX 77471
Estimated Value: $291,642 - $337,000
4
Beds
2
Baths
2,055
Sq Ft
$148/Sq Ft
Est. Value
About This Home
This home is located at 1405 Caslyn Dr, Rosenberg, TX 77471 and is currently estimated at $304,411, approximately $148 per square foot. 1405 Caslyn Dr is a home located in Fort Bend County with nearby schools including Smith Elementary School, J J Wessendorff Middle School, and Lamar Junior High School.
Ownership History
Date
Name
Owned For
Owner Type
Purchase Details
Closed on
Aug 30, 2019
Sold by
Alaniz Roman F and Alaniz Alva G
Bought by
Alaniz Roman Francisco
Current Estimated Value
Home Financials for this Owner
Home Financials are based on the most recent Mortgage that was taken out on this home.
Original Mortgage
$166,500
Outstanding Balance
$146,434
Interest Rate
3.8%
Mortgage Type
New Conventional
Estimated Equity
$157,977
Purchase Details
Closed on
Jul 12, 2002
Sold by
Petrosky Edmond and Petrosky Helen
Bought by
Alaniz Roman F and Alaniz Alva G
Purchase Details
Closed on
Sep 21, 1998
Sold by
General Homes Corp
Bought by
Petrosky Edmond and Petrosky Helen
Home Financials for this Owner
Home Financials are based on the most recent Mortgage that was taken out on this home.
Original Mortgage
$68,490
Interest Rate
5.25%
Mortgage Type
Purchase Money Mortgage
Create a Home Valuation Report for This Property
The Home Valuation Report is an in-depth analysis detailing your home's value as well as a comparison with similar homes in the area
Home Values in the Area
Average Home Value in this Area
Purchase History
| Date | Buyer | Sale Price | Title Company |
|---|---|---|---|
| Alaniz Roman Francisco | -- | Fidelity National Title | |
| Alaniz Roman F | -- | American Title Co | |
| Petrosky Edmond | -- | Fidelity National Title |
Source: Public Records
Mortgage History
| Date | Status | Borrower | Loan Amount |
|---|---|---|---|
| Open | Alaniz Roman Francisco | $166,500 | |
| Previous Owner | Petrosky Edmond | $68,490 |
Source: Public Records
Tax History Compared to Growth
Tax History
| Year | Tax Paid | Tax Assessment Tax Assessment Total Assessment is a certain percentage of the fair market value that is determined by local assessors to be the total taxable value of land and additions on the property. | Land | Improvement |
|---|---|---|---|---|
| 2025 | $4,557 | $306,730 | $33,150 | $279,074 |
| 2024 | $4,557 | $278,845 | -- | $291,306 |
| 2023 | $4,210 | $253,495 | $0 | $268,470 |
| 2022 | $3,852 | $230,450 | $0 | $243,690 |
| 2021 | $5,215 | $209,500 | $25,500 | $184,000 |
| 2020 | $5,040 | $198,030 | $25,500 | $172,530 |
| 2019 | $5,108 | $187,500 | $25,500 | $162,000 |
| 2018 | $5,100 | $182,710 | $25,500 | $157,210 |
| 2017 | $4,782 | $168,750 | $20,000 | $148,750 |
| 2016 | $4,348 | $153,410 | $20,000 | $133,410 |
| 2015 | $2,765 | $139,460 | $20,000 | $119,460 |
| 2014 | $2,652 | $126,780 | $20,000 | $106,780 |
Source: Public Records
Map
Nearby Homes
- 4707 E Parma Dr
- 1816 Spruce Dr
- 4605 Greenwood Dr
- 5106 Alderney Ct
- 5121 Alderney Ct
- 1504 Radio Ln
- 1403 Divin Dr
- 4717 Woodway Ave
- 1633 Jones St
- 1230 Law Ct
- 1711 Klauke St
- 1733 Brumbelow St
- 1803 Jones St
- 0 Miles St
- 1215 Lawrence St
- 1921 Ripple Creek Dr
- 1300 Lawrence St
- 1926 Klauke Ct
- 1317 Tobola St
- 1009 Lawrence St
- 1411 Caslyn Dr
- 4814 E Columbary Dr
- 1415 Caslyn Dr
- 4818 E Columbary Dr
- 4809 E Columbary Dr
- 1406 Caslyn Dr
- 1410 Caslyn Dr
- 4801 Cotter Ln
- 4813 E Columbary Dr
- 4805 E Columbary Dr
- 1414 Caslyn Dr
- 1419 Caslyn Dr
- 1402 Caslyn Dr
- 4817 E Columbary Dr
- 4805 Cotter Ln
- 4822 E Columbary Dr
- 1416 Caslyn Dr
- 4801 E Columbary Dr
- 4821 E Columbary Dr
- 1418 Caslyn Dr