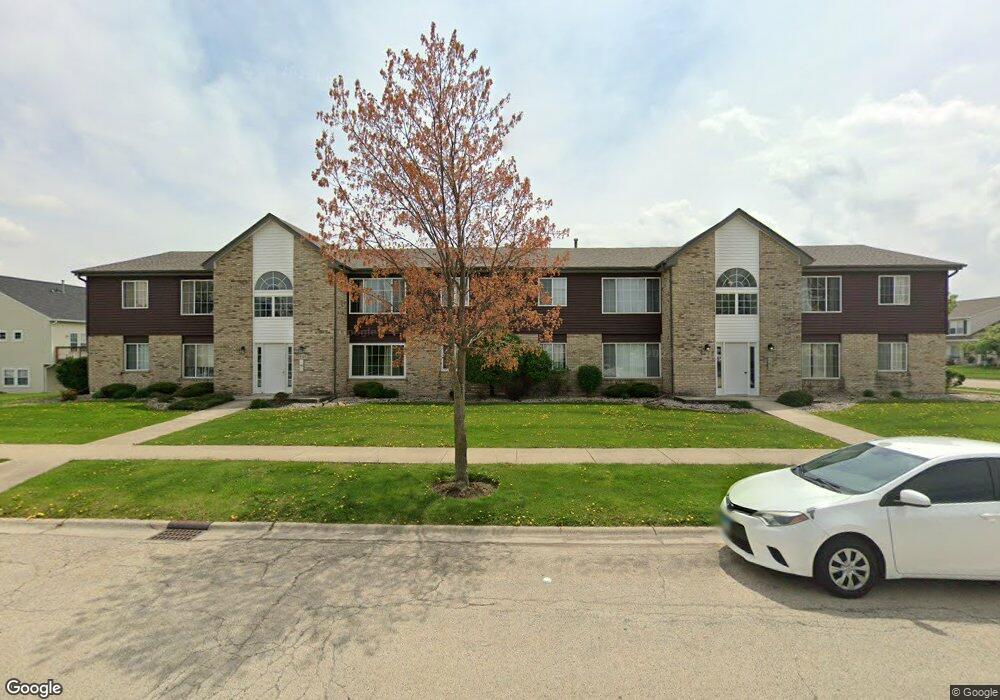
1405 Root St Unit 1W Crest Hill, IL 60403
Estimated Value: $161,000 - $178,899
--
Bed
--
Bath
--
Sq Ft
0.37
Acres
About This Home
This home is located at 1405 Root St Unit 1W, Crest Hill, IL 60403 and is currently estimated at $171,975. 1405 Root St Unit 1W is a home located in Will County with nearby schools including Richland Elementary School, Richland Jr High School, and Lockport Township High School East.
Ownership History
Date
Name
Owned For
Owner Type
Purchase Details
Closed on
May 10, 2002
Sold by
Cooper Marlene
Bought by
Sewall Chris A
Current Estimated Value
Home Financials for this Owner
Home Financials are based on the most recent Mortgage that was taken out on this home.
Original Mortgage
$84,850
Outstanding Balance
$36,182
Interest Rate
7.07%
Mortgage Type
FHA
Estimated Equity
$135,793
Purchase Details
Closed on
Jan 10, 2000
Sold by
Patterson June
Bought by
Hanna Carol and Stapleton Ronald
Purchase Details
Closed on
Nov 17, 1997
Sold by
Patterson June
Bought by
Patterson June and Stapelton Ronald
Purchase Details
Closed on
Jun 3, 1997
Sold by
State Bank Of Countryside
Bought by
Patterson June S
Purchase Details
Closed on
Sep 24, 1996
Sold by
State Bank Of Countryside
Bought by
Lapka Vickie W
Home Financials for this Owner
Home Financials are based on the most recent Mortgage that was taken out on this home.
Original Mortgage
$64,700
Interest Rate
7.97%
Mortgage Type
Purchase Money Mortgage
Create a Home Valuation Report for This Property
The Home Valuation Report is an in-depth analysis detailing your home's value as well as a comparison with similar homes in the area
Home Values in the Area
Average Home Value in this Area
Purchase History
| Date | Buyer | Sale Price | Title Company |
|---|---|---|---|
| Sewall Chris A | $87,500 | Chicago Title Insurance Co | |
| Hanna Carol | -- | -- | |
| Patterson June | -- | -- | |
| Patterson June S | $84,000 | Chicago Title Insurance Co | |
| Lapka Vickie W | $81,000 | Chicago Title Insurance Co |
Source: Public Records
Mortgage History
| Date | Status | Borrower | Loan Amount |
|---|---|---|---|
| Open | Sewall Chris A | $84,850 | |
| Previous Owner | Lapka Vickie W | $64,700 |
Source: Public Records
Tax History Compared to Growth
Tax History
| Year | Tax Paid | Tax Assessment Tax Assessment Total Assessment is a certain percentage of the fair market value that is determined by local assessors to be the total taxable value of land and additions on the property. | Land | Improvement |
|---|---|---|---|---|
| 2024 | $4,072 | $50,442 | $17,934 | $32,508 |
| 2023 | $4,072 | $45,284 | $16,100 | $29,184 |
| 2022 | $3,104 | $42,242 | $15,019 | $27,223 |
| 2021 | $2,922 | $39,697 | $14,114 | $25,583 |
| 2020 | $2,834 | $38,392 | $13,650 | $24,742 |
| 2019 | $2,667 | $36,390 | $12,938 | $23,452 |
| 2018 | $2,617 | $34,981 | $12,437 | $22,544 |
| 2017 | $2,459 | $33,023 | $11,741 | $21,282 |
| 2016 | $2,337 | $30,950 | $11,004 | $19,946 |
| 2015 | $2,066 | $27,781 | $9,877 | $17,904 |
| 2014 | $2,066 | $26,972 | $9,589 | $17,383 |
| 2013 | $2,066 | $27,807 | $9,886 | $17,921 |
Source: Public Records
Map
Nearby Homes
- 1400 Berta Dr
- 1429 Berta Dr Unit 2W
- 1339 Harvest Dr
- 1310 Harvest Dr
- 0 Essington & Ingalls Rd Unit MRD12400228
- 1804 Willow Circle Dr Unit D
- Vacant Heiden Ave
- 1822 Barthelone Ave
- 1694 Willow Circle Dr Unit B
- 1616 Heiden Ave
- 1824 Plainfield Rd
- LOTS 4 & 5 Plainfield Rd
- 1621 Innercircle Dr Unit 1
- 1922 Cowing Ln
- 17104 Weber Rd
- 1905 Innercircle Dr
- 2034 Manico Ct Unit 200
- 2034 Manico Ct Unit 101
- 1514 Burry St
- 1514 Hosmer St
- 1405 Root St Unit 2E
- 1405 Root St Unit 2W
- 1405 Root St Unit 1E
- 1401 Root St Unit 2E
- 1401 Root St Unit 2W
- 1401 Root St Unit 1W
- 1401 Root St Unit 1E
- 1411 Berta Dr Unit 1N
- 1411 Berta Dr Unit 10
- 1411 Berta Dr Unit 2S
- 1411 Berta Dr Unit 1S
- 1411 Berta Dr Unit 1
- 1411 Berta Dr Unit 1411
- 1365 Acorn Dr
- 1404 Root St
- 1400 Root St
- 1367 Acorn Dr
- 1363 Acorn Dr
- 1402 Berta Dr
- 1410 Root St