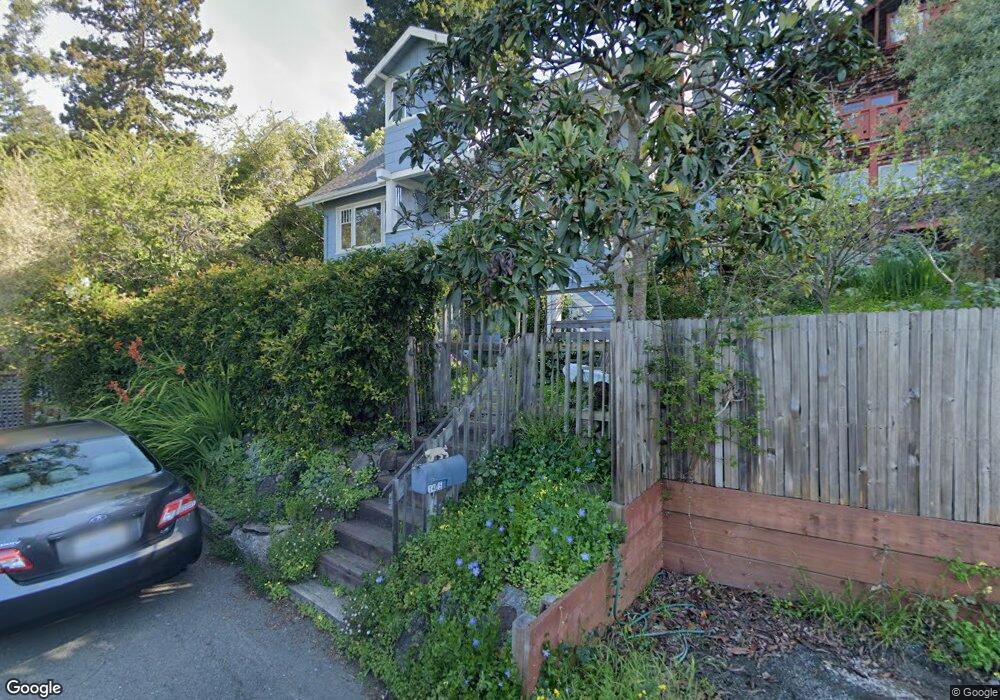
1405 Spring Way Berkeley, CA 94708
Berkeley Hills NeighborhoodEstimated Value: $735,000 - $1,719,205
5
Beds
3
Baths
1,917
Sq Ft
$630/Sq Ft
Est. Value
About This Home
This home is located at 1405 Spring Way, Berkeley, CA 94708 and is currently estimated at $1,207,051, approximately $629 per square foot. 1405 Spring Way is a home located in Alameda County with nearby schools including Berkeley Arts Magnet at Whittier School, Cragmont Elementary School, and Washington Elementary School.
Ownership History
Date
Name
Owned For
Owner Type
Purchase Details
Closed on
Aug 15, 2014
Sold by
Goldman Lenore
Bought by
Goldman Lenore B and The Lenore Beth Goldman 1999 T
Current Estimated Value
Home Financials for this Owner
Home Financials are based on the most recent Mortgage that was taken out on this home.
Original Mortgage
$106,000
Interest Rate
3.75%
Mortgage Type
Adjustable Rate Mortgage/ARM
Purchase Details
Closed on
Dec 12, 2013
Sold by
Goldman Lenore B
Bought by
Goldman Lenore B and The Lenore Beth Goldman 1999 T
Purchase Details
Closed on
Mar 15, 2001
Sold by
Goldman Lenore Beth and Lenore Beth Goldman 1999 Trust
Bought by
Goldman Lenore B
Home Financials for this Owner
Home Financials are based on the most recent Mortgage that was taken out on this home.
Original Mortgage
$242,000
Interest Rate
7.06%
Purchase Details
Closed on
Dec 17, 1999
Sold by
Goldman Lenore Beth
Bought by
Goldman Lenore Beth and Lenore Beth Goldman 1999 Trust
Create a Home Valuation Report for This Property
The Home Valuation Report is an in-depth analysis detailing your home's value as well as a comparison with similar homes in the area
Home Values in the Area
Average Home Value in this Area
Purchase History
| Date | Buyer | Sale Price | Title Company |
|---|---|---|---|
| Goldman Lenore B | -- | Old Republic Title Company | |
| Goldman Lenore | -- | Old Republic Title Company | |
| Goldman Lenore B | -- | None Available | |
| Goldman Lenore B | -- | First American Title Guarant | |
| Goldman Lenore Beth | -- | -- |
Source: Public Records
Mortgage History
| Date | Status | Borrower | Loan Amount |
|---|---|---|---|
| Closed | Goldman Lenore | $106,000 | |
| Closed | Goldman Lenore B | $242,000 |
Source: Public Records
Tax History
| Year | Tax Paid | Tax Assessment Tax Assessment Total Assessment is a certain percentage of the fair market value that is determined by local assessors to be the total taxable value of land and additions on the property. | Land | Improvement |
|---|---|---|---|---|
| 2025 | $10,040 | $521,248 | $158,474 | $369,774 |
| 2024 | $10,040 | $510,891 | $155,367 | $362,524 |
| 2023 | $9,744 | $507,737 | $152,321 | $355,416 |
| 2022 | $9,678 | $490,784 | $149,335 | $348,449 |
| 2021 | $9,673 | $481,024 | $146,407 | $341,617 |
| 2020 | $9,093 | $483,022 | $144,906 | $338,116 |
| 2019 | $8,657 | $473,552 | $142,065 | $331,487 |
| 2018 | $8,478 | $464,270 | $139,281 | $324,989 |
| 2017 | $8,171 | $455,168 | $136,550 | $318,618 |
| 2016 | $7,841 | $446,245 | $133,873 | $312,372 |
| 2015 | $7,720 | $439,545 | $131,863 | $307,682 |
| 2014 | $7,719 | $430,937 | $129,281 | $301,656 |
Source: Public Records
Map
Nearby Homes
- 1471 Scenic Ave
- 1444 Walnut St
- 1440 Walnut St Unit 5
- 2012 Rose St
- 2340 Virginia St
- 2600 Hilgard Ave
- 2201 Virginia St Unit 2
- 2451 Le Conte Ave
- 1136 Keith Ave
- 2634 Virginia St Unit 13
- 1106 Cragmont Ave
- 1425 Martin Luther King jr Way
- 1610 Milvia St
- 1165 Cragmont Ave
- 2700 Le Conte Ave Unit 301
- 2700 Le Conte Ave Unit 402
- 1609 Bonita Ave Unit 3
- 1609 Bonita Ave Unit 5
- 2015 Delaware St
- 2015 Delaware St Unit A
- 1400 Scenic Ave
- 1410 Scenic Ave
- 1406 Scenic Ave
- 1402 Spring Way
- 1404 Spring Way
- 1408 Spring Way
- 1422 Scenic Ave
- 2324 Rose St
- 2330 Rose St
- 1410 Spring Way
- 1412 Spring Way
- 1414 Spring Way Unit 1
- 2326 Rose St
- 2322 Rose St
- 1418 Spring Way
- 1407 Scenic Ave
- 1403 Arch St
- 1417 Arch St
- 1417 Arch St
- 1409 Scenic Ave
Your Personal Tour Guide
Ask me questions while you tour the home.