Estimated Value: $996,656 - $1,129,000
3
Beds
2
Baths
1,581
Sq Ft
$675/Sq Ft
Est. Value
About This Home
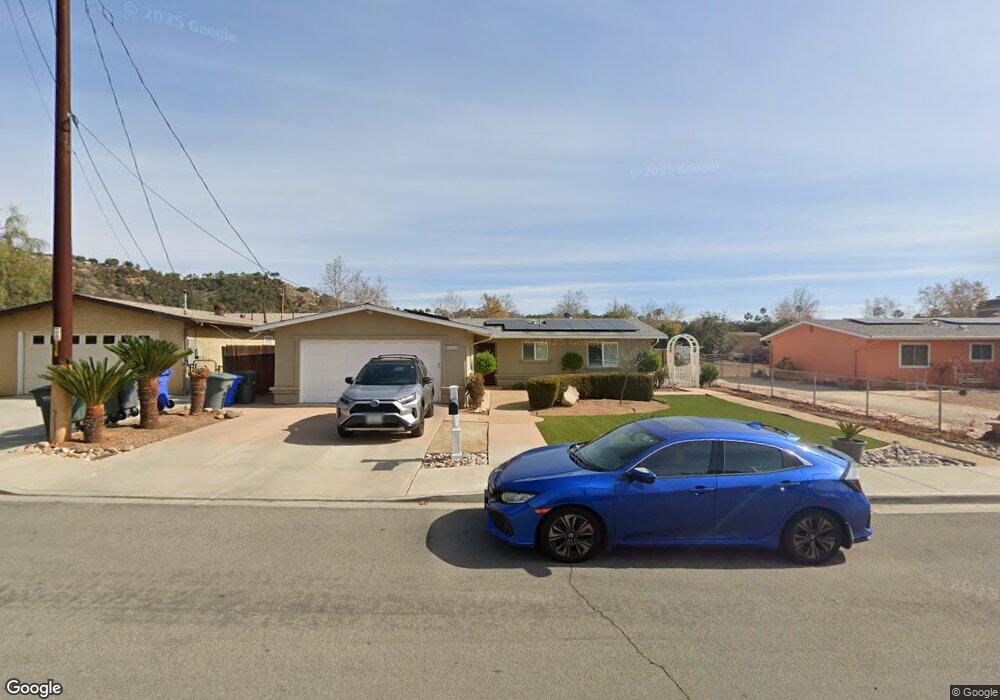
This home is located at 14053 Sycamore Ave, Poway, CA 92064 and is currently estimated at $1,066,914, approximately $674 per square foot. 14053 Sycamore Ave is a home located in San Diego County with nearby schools including Midland Elementary, Twin Peaks Middle, and Poway High.
Ownership History
Date
Name
Owned For
Owner Type
Purchase Details
Closed on
Aug 27, 2001
Sold by
Carpenter Elizabeth N
Bought by
Nigro Robert A and Nigro Sandra L
Current Estimated Value
Home Financials for this Owner
Home Financials are based on the most recent Mortgage that was taken out on this home.
Original Mortgage
$269,040
Outstanding Balance
$104,223
Interest Rate
6.9%
Estimated Equity
$962,691
Purchase Details
Closed on
Aug 18, 1994
Sold by
Carpenter Elizabeth N
Bought by
Carpenter Elizabeth N
Purchase Details
Closed on
Apr 19, 1994
Sold by
Carpenter Elizabeth N
Bought by
Carpenter Elizabeth N
Home Financials for this Owner
Home Financials are based on the most recent Mortgage that was taken out on this home.
Original Mortgage
$105,000
Interest Rate
4.12%
Create a Home Valuation Report for This Property
The Home Valuation Report is an in-depth analysis detailing your home's value as well as a comparison with similar homes in the area
Home Values in the Area
Average Home Value in this Area
Purchase History
| Date | Buyer | Sale Price | Title Company |
|---|---|---|---|
| Nigro Robert A | $283,500 | Commonwealth Title Co | |
| Carpenter Elizabeth N | -- | -- | |
| Carpenter Elizabeth N | -- | Orange Coast Title Company |
Source: Public Records
Mortgage History
| Date | Status | Borrower | Loan Amount |
|---|---|---|---|
| Open | Nigro Robert A | $269,040 | |
| Previous Owner | Carpenter Elizabeth N | $105,000 |
Source: Public Records
Tax History
| Year | Tax Paid | Tax Assessment Tax Assessment Total Assessment is a certain percentage of the fair market value that is determined by local assessors to be the total taxable value of land and additions on the property. | Land | Improvement |
|---|---|---|---|---|
| 2025 | $4,738 | $429,165 | $295,451 | $133,714 |
| 2024 | $4,738 | $420,751 | $289,658 | $131,093 |
| 2023 | $4,637 | $412,502 | $283,979 | $128,523 |
| 2022 | $4,559 | $404,414 | $278,411 | $126,003 |
| 2021 | $4,499 | $396,485 | $272,952 | $123,533 |
| 2020 | $4,439 | $392,421 | $270,154 | $122,267 |
| 2019 | $4,324 | $384,727 | $264,857 | $119,870 |
| 2018 | $4,203 | $377,184 | $259,664 | $117,520 |
| 2017 | $4,090 | $369,789 | $254,573 | $115,216 |
| 2016 | $4,006 | $362,539 | $249,582 | $112,957 |
| 2015 | $3,946 | $357,095 | $245,834 | $111,261 |
| 2014 | $3,757 | $341,277 | $241,019 | $100,258 |
Source: Public Records
Map
Nearby Homes
- 13947 Midland Rd
- 13908 Hibiscus Ave Unit 40
- 13941 Wisteria Ave
- 14003 Jasmine Ave Unit 193
- 14089 Pomegranate Ave Unit 214
- 14120 Kendra Way
- 14240 Kendra Way
- 14403 Gaslight Ct
- 14334 Sandown Ct
- 000 Carlson Ct 9 Unit 9
- 13422 Little Dawn Ln
- 13619 Sycamore Tree Ln
- 13643 Melissa Ln
- 13780 Holly Oak Way
- 13765 Holly Oak Way
- 12885 Rockwell Ct
- 14637 Poway Mesa Dr
- 13650 Mulberry Tree Ct Unit 167
- 13972 Poway Valley Rd
- 14118 Ipava Dr
- 14061 Sycamore Ave
- 14043 Sycamore Ave
- 14035 Sycamore Ave
- 14031 Sycamore Ave
- 14056 Sycamore Ave
- 14025 Sycamore Ave
- 14040 Sycamore Ave
- 14021 Sycamore Ave
- 14038 Sycamore Ave
- 14026 Sycamore Ave
- 14020 Sycamore Ave
- 14055 14055 Midland Rd
- 14055 Midland Rd
- 14016 Midland Rd
- 14126 Sycamore Ave
- 14012 Sycamore Ave
- 14063 York Ave
- 14115 York Ave
- 13526 Edgemoor St Unit 28
- 13526 Edgemoor St
Your Personal Tour Guide
Ask me questions while you tour the home.