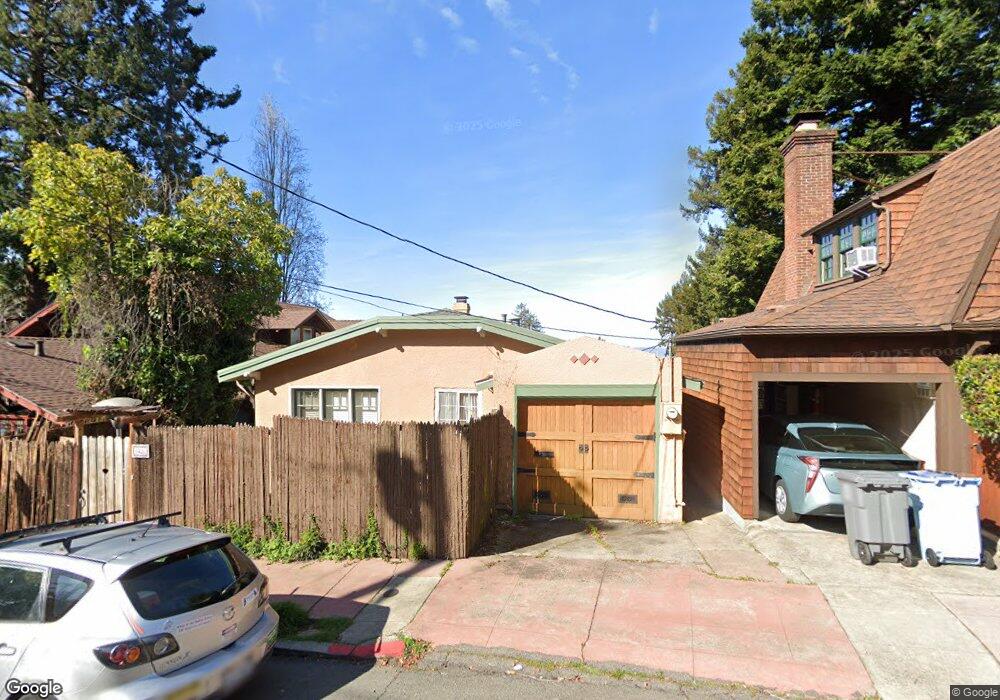
1406 Scenic Ave Berkeley, CA 94708
Berkeley Hills NeighborhoodEstimated Value: $1,187,000 - $1,433,000
4
Beds
2
Baths
536
Sq Ft
$2,440/Sq Ft
Est. Value
About This Home
This home is located at 1406 Scenic Ave, Berkeley, CA 94708 and is currently estimated at $1,308,021, approximately $2,440 per square foot. 1406 Scenic Ave is a home located in Alameda County with nearby schools including Berkeley Arts Magnet at Whittier School, Cragmont Elementary School, and Washington Elementary School.
Ownership History
Date
Name
Owned For
Owner Type
Purchase Details
Closed on
Dec 31, 2008
Sold by
Potash Daniel
Bought by
Potash Dan and The Dan Potash Trust
Current Estimated Value
Home Financials for this Owner
Home Financials are based on the most recent Mortgage that was taken out on this home.
Original Mortgage
$600,000
Outstanding Balance
$375,794
Interest Rate
5.01%
Mortgage Type
New Conventional
Estimated Equity
$932,227
Purchase Details
Closed on
Sep 12, 2005
Sold by
Potash Daniel V
Bought by
Potash Dan and The Dan Potash Trust
Purchase Details
Closed on
Jan 25, 2000
Sold by
Ben Ari Yaron and Ben Ari Adital
Bought by
Potash Daniel V
Home Financials for this Owner
Home Financials are based on the most recent Mortgage that was taken out on this home.
Original Mortgage
$340,800
Interest Rate
7.87%
Create a Home Valuation Report for This Property
The Home Valuation Report is an in-depth analysis detailing your home's value as well as a comparison with similar homes in the area
Home Values in the Area
Average Home Value in this Area
Purchase History
| Date | Buyer | Sale Price | Title Company |
|---|---|---|---|
| Potash Dan | -- | Old Republic Title Company | |
| Potash Daniel | -- | Old Republic Title Company | |
| Potash Dan | -- | -- | |
| Potash Daniel V | $426,000 | Placer Title Company |
Source: Public Records
Mortgage History
| Date | Status | Borrower | Loan Amount |
|---|---|---|---|
| Open | Potash Daniel | $600,000 | |
| Closed | Potash Daniel V | $340,800 | |
| Closed | Potash Daniel V | $42,600 |
Source: Public Records
Tax History
| Year | Tax Paid | Tax Assessment Tax Assessment Total Assessment is a certain percentage of the fair market value that is determined by local assessors to be the total taxable value of land and additions on the property. | Land | Improvement |
|---|---|---|---|---|
| 2025 | $10,344 | $647,714 | $196,414 | $458,300 |
| 2024 | $10,344 | $634,878 | $192,563 | $449,315 |
| 2023 | $10,124 | $629,295 | $188,788 | $440,507 |
| 2022 | $9,933 | $609,958 | $185,087 | $431,871 |
| 2021 | $9,948 | $597,864 | $181,459 | $423,405 |
| 2020 | $9,394 | $598,665 | $179,599 | $419,066 |
| 2019 | $9,002 | $586,930 | $176,079 | $410,851 |
| 2018 | $8,845 | $575,423 | $172,627 | $402,796 |
| 2017 | $8,531 | $564,142 | $169,242 | $394,900 |
| 2016 | $8,241 | $553,084 | $165,925 | $387,159 |
| 2015 | $8,128 | $544,777 | $163,433 | $381,344 |
| 2014 | $8,065 | $534,105 | $160,231 | $373,874 |
Source: Public Records
Map
Nearby Homes
- 1444 Walnut St
- 2340 Virginia St
- 2600 Hilgard Ave
- 2012 Rose St
- 2201 Virginia St Unit 2
- 2451 Le Conte Ave
- 1136 Keith Ave
- 2634 Virginia St Unit 13
- 1106 Cragmont Ave
- 2700 Le Conte Ave Unit 301
- 2700 Le Conte Ave Unit 402
- 2704 Le Conte Ave Unit 4
- 1425 Martin Luther King jr Way
- 1610 Milvia St
- 1165 Cragmont Ave
- 1609 Bonita Ave Unit 3
- 1609 Bonita Ave Unit 5
- 2015 Delaware St
- 2015 Delaware St Unit A
- 1110 Sterling Ave
- 1400 Scenic Ave
- 1410 Scenic Ave
- 1405 Spring Way
- 1422 Scenic Ave
- 1407 Scenic Ave
- 1409 Scenic Ave
- 1402 Spring Way
- 1403 Scenic Ave
- 1404 Spring Way
- 2330 Rose St
- 1408 Spring Way
- 1425 Scenic Ave
- 1401 Scenic Ave
- 1423 Scenic Ave
- 1443 Scenic Ave
- 2324 Rose St
- 2326 Rose St
- 1410 Hawthorne Terrace
- 1418 Spring Way
- 1350 Scenic Ave
Your Personal Tour Guide
Ask me questions while you tour the home.