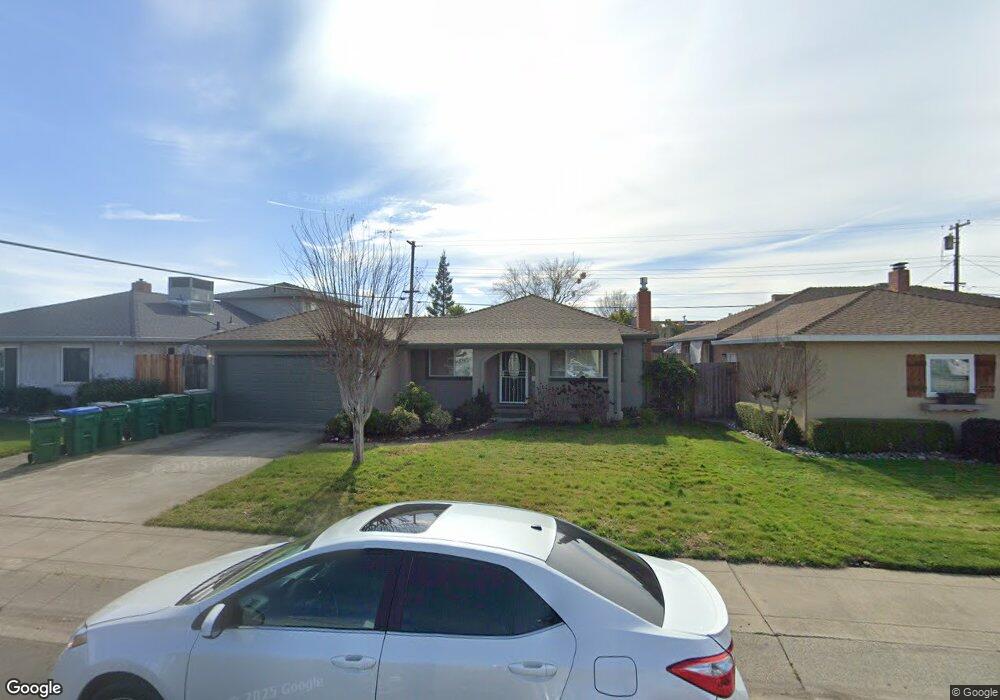
1406 W Locust St Lodi, CA 95242
North Lodi NeighborhoodEstimated Value: $356,000 - $396,385
3
Beds
1
Bath
1,128
Sq Ft
$341/Sq Ft
Est. Value
About This Home
This home is located at 1406 W Locust St, Lodi, CA 95242 and is currently estimated at $384,596, approximately $340 per square foot. 1406 W Locust St is a home located in San Joaquin County with nearby schools including Erma B. Reese Elementary School, Millswood Middle School, and Lodi High School.
Ownership History
Date
Name
Owned For
Owner Type
Purchase Details
Closed on
May 9, 2013
Sold by
Nobriga John and Nobriga Karrie
Bought by
Nobriga John and Nobriga Karrie
Current Estimated Value
Purchase Details
Closed on
Nov 19, 2010
Sold by
Bankunited
Bought by
Nobriga John and Nobriga Karrie
Purchase Details
Closed on
Oct 13, 2010
Sold by
Theodore Luke M
Bought by
Bankunited and Fdic
Purchase Details
Closed on
Apr 19, 2004
Sold by
Vargo Jimmie B
Bought by
Theodore Luke
Home Financials for this Owner
Home Financials are based on the most recent Mortgage that was taken out on this home.
Original Mortgage
$255,000
Interest Rate
5.35%
Mortgage Type
Purchase Money Mortgage
Purchase Details
Closed on
Sep 21, 2001
Sold by
Metler Vic R and Metler Carrie C
Bought by
Vargo Jimmie B
Home Financials for this Owner
Home Financials are based on the most recent Mortgage that was taken out on this home.
Original Mortgage
$105,000
Interest Rate
12.37%
Create a Home Valuation Report for This Property
The Home Valuation Report is an in-depth analysis detailing your home's value as well as a comparison with similar homes in the area
Home Values in the Area
Average Home Value in this Area
Purchase History
| Date | Buyer | Sale Price | Title Company |
|---|---|---|---|
| Nobriga John | -- | None Available | |
| Nobriga John | $125,000 | None Available | |
| Bankunited | $135,000 | None Available | |
| Theodore Luke | $255,000 | Fidelity Natl Title Ins Co | |
| Vargo Jimmie B | $155,000 | Alliance Title Company |
Source: Public Records
Mortgage History
| Date | Status | Borrower | Loan Amount |
|---|---|---|---|
| Previous Owner | Theodore Luke | $255,000 | |
| Previous Owner | Vargo Jimmie B | $105,000 |
Source: Public Records
Tax History
| Year | Tax Paid | Tax Assessment Tax Assessment Total Assessment is a certain percentage of the fair market value that is determined by local assessors to be the total taxable value of land and additions on the property. | Land | Improvement |
|---|---|---|---|---|
| 2025 | $1,746 | $160,009 | $39,713 | $120,296 |
| 2024 | $1,698 | $156,873 | $38,935 | $117,938 |
| 2023 | $1,678 | $153,798 | $38,172 | $115,626 |
| 2022 | $1,641 | $150,783 | $37,424 | $113,359 |
| 2021 | $1,670 | $147,828 | $36,691 | $111,137 |
| 2020 | $1,627 | $146,313 | $36,315 | $109,998 |
| 2019 | $1,595 | $143,445 | $35,603 | $107,842 |
| 2018 | $1,573 | $140,633 | $34,905 | $105,728 |
| 2017 | $1,538 | $137,876 | $34,221 | $103,655 |
| 2016 | $1,442 | $135,173 | $33,550 | $101,623 |
| 2014 | $1,408 | $130,536 | $32,399 | $98,137 |
Source: Public Records
Map
Nearby Homes
- 1413 Mariposa Way
- 1501 Mariposa Way
- 1424 Graffigna Ave
- 1606 W Lockeford St
- 400 N Pacific Ave
- 1416 Reiman St
- 527 Cross St
- 507 N Sunset Dr
- 1215 W Walnut St
- 135 S Fairmont Ave
- 2019 Debbie Ln
- 119 S Avena Ave
- 1507 Holly Dr
- 1126 Lake Home Dr
- 2127 Oxford Way
- 524 Nevins Dr
- 6652 W Turner Rd
- 525 Eureka Ave
- 333 W Locust St
- 606 W Turner Rd
- 1400 W Locust St
- 1412 W Locust St
- 1407 W Elm St
- 1418 W Locust St
- 1401 W Elm St
- 1413 W Elm St
- 1407 W Locust St
- 1401 W Locust St
- 1413 W Locust St
- 1424 W Locust St
- 1419 W Elm St
- 1419 W Locust St Unit 2
- 1430 W Locust St
- 1425 W Elm St
- 1425 W Locust St
- 1410 Mariposa Way
- 211 N Pacific Ave
- 1416 Mariposa Way
- 1431 W Locust St
- 1436 W Locust St
Your Personal Tour Guide
Ask me questions while you tour the home.