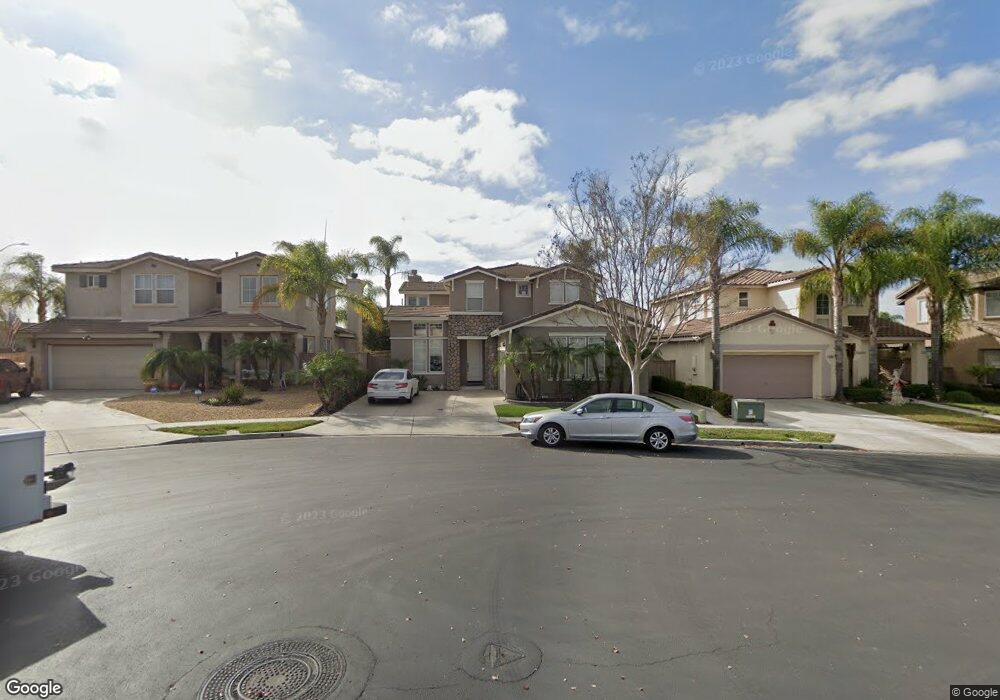
1408 Cascade Place Chula Vista, CA 91913
Otay Ranch NeighborhoodEstimated Value: $995,895 - $1,027,000
4
Beds
3
Baths
2,292
Sq Ft
$442/Sq Ft
Est. Value
About This Home
This home is located at 1408 Cascade Place, Chula Vista, CA 91913 and is currently estimated at $1,012,724, approximately $441 per square foot. 1408 Cascade Place is a home located in San Diego County with nearby schools including Anne & William Hedenkamp Elementary School, Rancho Del Rey Middle School, and Otay Ranch Senior High School.
Ownership History
Date
Name
Owned For
Owner Type
Purchase Details
Closed on
May 14, 2021
Sold by
Mau Michael L and Mau April G
Bought by
Mau Michael Lawrence and Mau April Genevieve
Current Estimated Value
Purchase Details
Closed on
Apr 6, 2004
Sold by
Mau Michael L and Mau April G
Bought by
Mau Michael L and Mau April G
Home Financials for this Owner
Home Financials are based on the most recent Mortgage that was taken out on this home.
Original Mortgage
$360,000
Outstanding Balance
$166,808
Interest Rate
5.44%
Mortgage Type
Stand Alone Refi Refinance Of Original Loan
Estimated Equity
$845,916
Purchase Details
Closed on
Jul 9, 2003
Sold by
Mau April G
Bought by
Mau Michael L and Mau April G
Purchase Details
Closed on
Nov 12, 2002
Sold by
Rwr Otay Investors 49A Llc
Bought by
Mau April G
Home Financials for this Owner
Home Financials are based on the most recent Mortgage that was taken out on this home.
Original Mortgage
$327,250
Interest Rate
4.46%
Purchase Details
Closed on
Jul 25, 2002
Sold by
Mau Michael L
Bought by
Mau April G
Create a Home Valuation Report for This Property
The Home Valuation Report is an in-depth analysis detailing your home's value as well as a comparison with similar homes in the area
Home Values in the Area
Average Home Value in this Area
Purchase History
| Date | Buyer | Sale Price | Title Company |
|---|---|---|---|
| Mau Michael Lawrence | -- | None Available | |
| Mau Michael L | -- | North American Title Co | |
| Mau Michael L | -- | -- | |
| Mau April G | $385,000 | Chicago Title Co | |
| Mau April G | -- | Chicago Title |
Source: Public Records
Mortgage History
| Date | Status | Borrower | Loan Amount |
|---|---|---|---|
| Open | Mau Michael L | $360,000 | |
| Closed | Mau April G | $327,250 |
Source: Public Records
Tax History
| Year | Tax Paid | Tax Assessment Tax Assessment Total Assessment is a certain percentage of the fair market value that is determined by local assessors to be the total taxable value of land and additions on the property. | Land | Improvement |
|---|---|---|---|---|
| 2025 | $7,686 | $557,589 | $188,275 | $369,314 |
| 2024 | $7,686 | $546,657 | $184,584 | $362,073 |
| 2023 | $7,647 | $535,939 | $180,965 | $354,974 |
| 2022 | $7,549 | $525,431 | $177,417 | $348,014 |
| 2021 | $7,454 | $515,130 | $173,939 | $341,191 |
| 2020 | $8,843 | $509,849 | $172,156 | $337,693 |
| 2019 | $8,643 | $499,853 | $168,781 | $331,072 |
| 2018 | $8,503 | $490,053 | $165,472 | $324,581 |
| 2017 | $13 | $480,445 | $162,228 | $318,217 |
| 2016 | $8,059 | $471,026 | $159,048 | $311,978 |
| 2015 | $7,880 | $463,951 | $156,659 | $307,292 |
| 2014 | $7,634 | $425,000 | $170,000 | $255,000 |
Source: Public Records
Map
Nearby Homes
- 1004 Red Granite Rd
- 1382 Stoney Spring Ct
- 1175 Santa Olivia Rd
- 1203 Santa Olivia Rd
- 1539 Santa Sierra Dr
- 1413 La Chica Dr
- 1286 Wheatland St
- 1186 De Anza Ct
- 1519 Taber Dr
- 843 Caminito Las Olas
- 1405 Carneros Valley St
- 1041 Paseo Del Norte
- 841 Hana Ave Unit 3
- 1382 Cathedral Oaks Rd
- 1060 Via Sinuoso
- 1417 Cathedral Oaks Rd
- 830 Cinnamon Ct
- 821 Mateo St Unit 1
- 1413 Filmore Place
- 820 Cardamom Ct
- 1404 Cascade Place
- 1412 Cascade Place
- 1409 Brookside Place
- 1413 Brookside Place
- 1400 Cascade Place
- 1405 Brookside Place
- 1396 Cascade Place
- 1405 Cascade Place
- 1409 Cascade Place
- 1401 Brookside Place
- 1413 Cascade Place
- 1076 Strawberry Creek St
- 1080 Strawberry Creek St
- 1066 Strawberry Creek St
- 1397 Brookside Place
- 1058 Strawberry Creek St
- 1084 Strawberry Creek St
- 1054 Strawberry Creek St
- 1049 Mount Dana Dr
- 1092 Strawberry Creek St
Your Personal Tour Guide
Ask me questions while you tour the home.