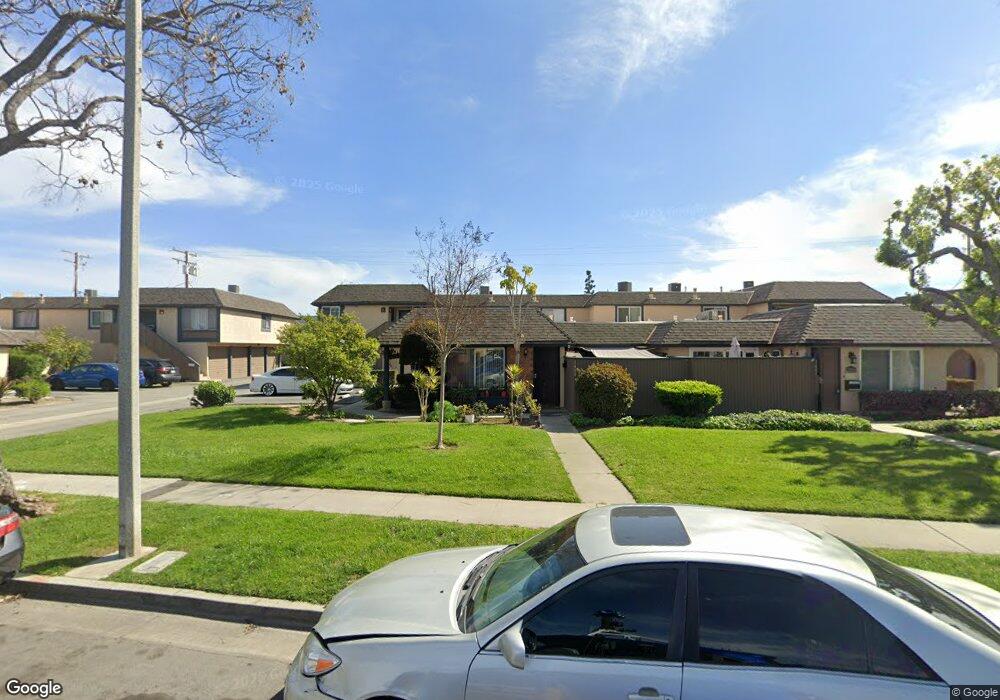
1408 E Bell Ave Unit 102D Anaheim, CA 92805
Southeast Anaheim NeighborhoodEstimated Value: $575,000 - $632,000
3
Beds
2
Baths
1,118
Sq Ft
$538/Sq Ft
Est. Value
About This Home
This home is located at 1408 E Bell Ave Unit 102D, Anaheim, CA 92805 and is currently estimated at $601,504, approximately $538 per square foot. 1408 E Bell Ave Unit 102D is a home located in Orange County with nearby schools including Theodore Roosevelt Elementary School, South Junior High School, and Katella High School.
Ownership History
Date
Name
Owned For
Owner Type
Purchase Details
Closed on
Nov 20, 2012
Sold by
Subur Susila
Bought by
Kumala Subur Family Trust
Current Estimated Value
Purchase Details
Closed on
May 1, 2012
Sold by
Subur Susila and Kumala Ferdinand
Bought by
Subur Susila
Home Financials for this Owner
Home Financials are based on the most recent Mortgage that was taken out on this home.
Original Mortgage
$252,500
Outstanding Balance
$177,789
Interest Rate
4.25%
Mortgage Type
New Conventional
Estimated Equity
$423,715
Purchase Details
Closed on
May 17, 2005
Sold by
Alexander H Adrian and Alexander Carolyn L
Bought by
Subur Susila
Home Financials for this Owner
Home Financials are based on the most recent Mortgage that was taken out on this home.
Original Mortgage
$43,250
Interest Rate
5.84%
Mortgage Type
Purchase Money Mortgage
Create a Home Valuation Report for This Property
The Home Valuation Report is an in-depth analysis detailing your home's value as well as a comparison with similar homes in the area
Home Values in the Area
Average Home Value in this Area
Purchase History
| Date | Buyer | Sale Price | Title Company |
|---|---|---|---|
| Kumala Subur Family Trust | -- | None Available | |
| Subur Susila | -- | Orange Coast Title Company O | |
| Subur Susila | $372,500 | First American Title Co |
Source: Public Records
Mortgage History
| Date | Status | Borrower | Loan Amount |
|---|---|---|---|
| Open | Subur Susila | $252,500 | |
| Closed | Subur Susila | $43,250 |
Source: Public Records
Tax History Compared to Growth
Tax History
| Year | Tax Paid | Tax Assessment Tax Assessment Total Assessment is a certain percentage of the fair market value that is determined by local assessors to be the total taxable value of land and additions on the property. | Land | Improvement |
|---|---|---|---|---|
| 2025 | $5,981 | $519,222 | $420,198 | $99,024 |
| 2024 | $5,981 | $509,042 | $411,959 | $97,083 |
| 2023 | $5,856 | $499,061 | $403,881 | $95,180 |
| 2022 | $5,300 | $445,740 | $370,344 | $75,396 |
| 2021 | $5,310 | $437,000 | $363,082 | $73,918 |
| 2020 | $4,986 | $406,000 | $332,082 | $73,918 |
| 2019 | $4,927 | $406,000 | $332,082 | $73,918 |
| 2018 | $4,915 | $406,000 | $332,082 | $73,918 |
| 2017 | $4,084 | $340,000 | $266,082 | $73,918 |
| 2016 | $4,147 | $340,000 | $266,082 | $73,918 |
| 2015 | $3,604 | $290,000 | $216,082 | $73,918 |
| 2014 | $3,211 | $268,088 | $194,170 | $73,918 |
Source: Public Records
Map
Nearby Homes
- 1101 S Clifpark Cir
- 2144 E Almont Ave
- 617 E Eton Place
- 1415 E South St
- 611 E Eton Place
- 1615 E South St
- 725 S Mosaic St
- 1400 S Sunkist St Unit 214
- 1400 S Sunkist St Unit 82
- 1400 S Sunkist St Unit 173
- 1400 S Sunkist St Unit 170
- 1400 S Sunkist St Unit 80
- 2641 E Paladin Ave
- 700 S Plymouth Place
- 554 S Elder St
- 760 S Olive St
- 1206 W Cara Dr
- 1539 W Cara Dr
- 1638 S Urbana St
- 1422 S Urbana St
- 1412 E Bell Ave Unit 104
- 1404 E Bell Ave Unit 100
- 1414 E Bell Ave Unit 105R
- 1414 E Bell Ave
- 1410 E Bell Ave Unit 103p
- 1410 E Bell Ave
- 1406 E Bell Ave Unit 101N
- 1406 E Bell Ave
- 1402 E Bell Ave Unit 99L
- 1416 E Bell Ave Unit 106K
- 1418 E Bell Ave Unit 107L
- 1418 E Bell Ave Unit 1071
- 1274 E Bell Ave Unit 97R
- 1274 E Bell Ave
- 1420 E Bell Ave Unit 108
- 1272 E Bell Ave
- 1422 E Bell Ave
- 1268 E Bell Ave Unit 940
- 1424 E Bell Ave Unit 110O
- 1424 E Bell Ave