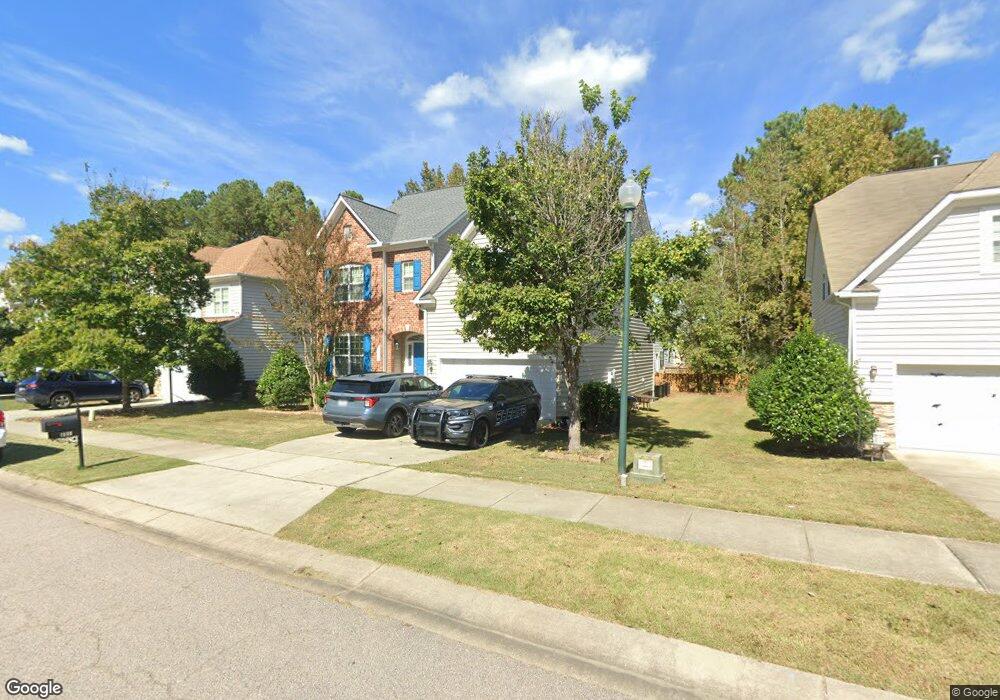
1408 Lindenberg Square Wake Forest, NC 27587
Estimated Value: $395,727 - $524,000
5
Beds
4
Baths
2,753
Sq Ft
$165/Sq Ft
Est. Value
About This Home
This home is located at 1408 Lindenberg Square, Wake Forest, NC 27587 and is currently estimated at $453,682, approximately $164 per square foot. 1408 Lindenberg Square is a home located in Wake County with nearby schools including Rolesville Elementary School, Wake Forest-Rolesville Middle School, and Heritage High School.
Ownership History
Date
Name
Owned For
Owner Type
Purchase Details
Closed on
Sep 21, 2015
Sold by
National Transfer Services Llc
Bought by
Kebaso Nancy and Manoti Geoffrey M
Current Estimated Value
Home Financials for this Owner
Home Financials are based on the most recent Mortgage that was taken out on this home.
Original Mortgage
$235,347
Outstanding Balance
$183,834
Interest Rate
3.75%
Mortgage Type
FHA
Estimated Equity
$269,848
Purchase Details
Closed on
Oct 12, 2005
Sold by
Lennar Carolinas Llc
Bought by
Ballard William C
Home Financials for this Owner
Home Financials are based on the most recent Mortgage that was taken out on this home.
Original Mortgage
$224,991
Interest Rate
5.71%
Mortgage Type
Fannie Mae Freddie Mac
Create a Home Valuation Report for This Property
The Home Valuation Report is an in-depth analysis detailing your home's value as well as a comparison with similar homes in the area
Home Values in the Area
Average Home Value in this Area
Purchase History
| Date | Buyer | Sale Price | Title Company |
|---|---|---|---|
| Kebaso Nancy | $257,000 | None Available | |
| National Transfer Services Llc | $270,000 | None Available | |
| Ballard William C | $250,000 | None Available |
Source: Public Records
Mortgage History
| Date | Status | Borrower | Loan Amount |
|---|---|---|---|
| Open | National Transfer Services Llc | $235,347 | |
| Closed | National Transfer Services Llc | $235,347 | |
| Previous Owner | Ballard William C | $224,991 |
Source: Public Records
Tax History
| Year | Tax Paid | Tax Assessment Tax Assessment Total Assessment is a certain percentage of the fair market value that is determined by local assessors to be the total taxable value of land and additions on the property. | Land | Improvement |
|---|---|---|---|---|
| 2025 | $3,450 | $353,161 | $100,000 | $253,161 |
| 2024 | $3,438 | $353,161 | $100,000 | $253,161 |
Source: Public Records
Map
Nearby Homes
- 3908 Robins Nest Ln
- 3705 Andoversford Ct
- 9117 Linslade Way
- 9108 Linslade Way
- 712 Marshall Farm St
- 9100 Dansforeshire Way
- 749 Marshall Farm St
- 6633 Penfield St
- 337 Simwood Ave
- 1321 Yardley Dr
- 3901 Sanford Creek Ave
- 3807 Crimson Clover Ave
- 2925 Carriage Meadows Dr
- 3821 Heritage Spring Cir
- 3819 Heritage Spring Cir
- 904 Prairie Smoke St
- 3830 Heritage View Trail
- 3819 Wild Meadow Ln
- 9637 Burge Ct
- 3854 Wild Meadow Ln
- 1404 Lindenberg Square
- 1412 Lindenberg Square
- 3912 Robins Nest Ln
- 1416 Lindenberg Square
- 1400 Lindenberg Square
- 1316 Lindenberg Square
- 3929 Robins Nest Ln
- 1409 Lindenberg Square
- 1413 Lindenberg Square
- 1312 Lindenberg Square
- 1420 Lindenberg Square
- 1405 Lindenberg Square
- 1417 Lindenberg Square
- 1401 Lindenberg Square
- 1308 Lindenberg Square
- 3925 Robins Nest Ln
- 1421 Lindenberg Square
- 1424 Lindenberg Square
- 3921 Robins Nest Ln
- 1304 Lindenberg Square
Your Personal Tour Guide
Ask me questions while you tour the home.